
📝 Note: This article was last updated on Jan. 21, 2026. We regularly update the information to ensure you have the latest insights! 😊
Introduction
Last year we published a review of core dashboard tools, highlighting several common challenges teams encounter when building data visualizations. Most of the tools we discussed were mature commercial products with good user experience, yet they offered limited flexibility in licensing, deployment, and extensibility. In conversations with readers afterward, we learned that many teams were actually seeking lower cost, more customizable, and self hosted open source alternatives.

💡Recommended reading: A Developer’s Technical Decision Guide to No-Code and Low-Code (2026)
Over the past year, the open source ecosystem in this space has evolved quickly. Increasingly, dashboard and analytics tools are incorporating AI into their core features, including natural language querying, automated chart creation, metric explanations, and semantic report generation. Many teams also hope these tools can handle more of the operational workload so they can focus their time on decisions that require real business judgment.
💬 Hey, you’re reading the NocoBase blog. NocoBase is the most extensible AI-powered no-code/low-code development platform for building enterprise applications, internal tools, and all kinds of systems. It’s fully self-hosted, plugin-based, and developer-friendly. → Explore NocoBase on GitHub
With this context in mind, we curated a new list of active open source dashboard projects that have already introduced AI capabilities. In this article, we look at each tool through three lenses: its core positioning, common use cases, and the maturity and scope of its AI features. We hope this helps you quickly identify which open source tool best fits your needs.
Here is a quick overview of the six tools we will cover.
| Tool | Platform type | AI maturity | How AI is implemented |
|---|---|---|---|
| NocoBase | Open source AI powered no code platform for building business systems and dashboards | ★★★★☆ | Native AI employee framework for modeling, data entry, visual analysis, and extendable custom agents |
| Wren AI | Open source generative BI with natural language querying and auto visualization | ★★★★☆ | Native generative analytics including Text to SQL, Text to Chart, and semantic layer |
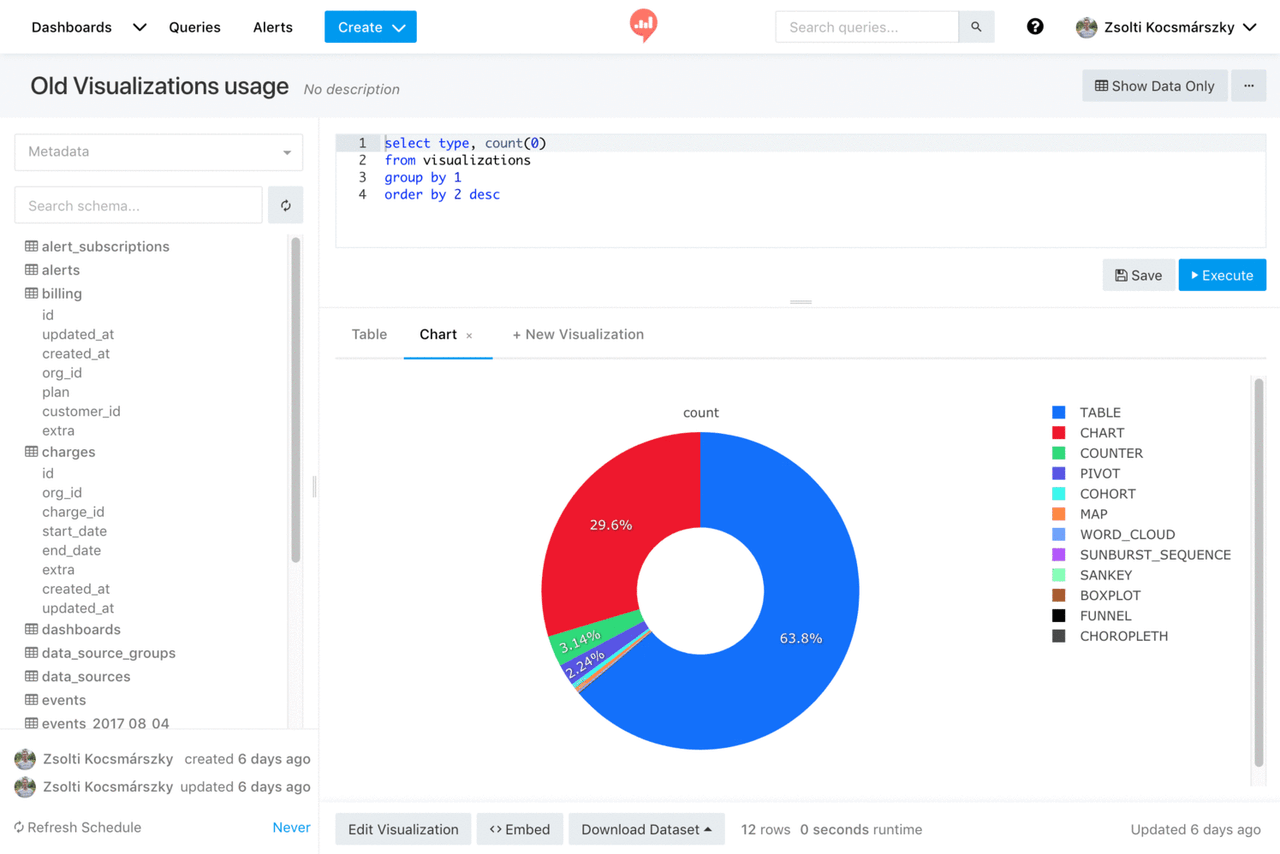
| Redash | SQL based query and visualization tool for lightweight BI dashboards | ★★★☆☆ | No native AI, can connect external models to enable Text to SQL and analysis features |
| Appsmith | Visual application builder for internal tools and business panels | ★★★★☆ | Native AI Assistant that generates UI, data logic, and copy |
| Metabase | Enterprise ready open source BI platform for data exploration and dashboards | ★★★★☆ | Native Metabot for natural language querying and metric explanations |
| Grafana | Observability and time series dashboard platform also used for business visualization | ★★★☆☆ | No native AI, plugins or external models can enable anomaly detection and analysis |
Tool recommendation
NocoBase
 Official site: https://www.nocobase.com
Documentation: https://v2.docs.nocobase.com/
GitHub: https://github.com/nocobase/nocobase
GitHub Stars: 20.7k
Overview
NocoBase is an open source and self hostable AI no code development platform built on a unified data model and an extensible plugin architecture. The platform supports business records, data management, and visualization building under one data structure. It is suitable for building internal applications and creating dashboards and BI boards based on business system data.
Core uses
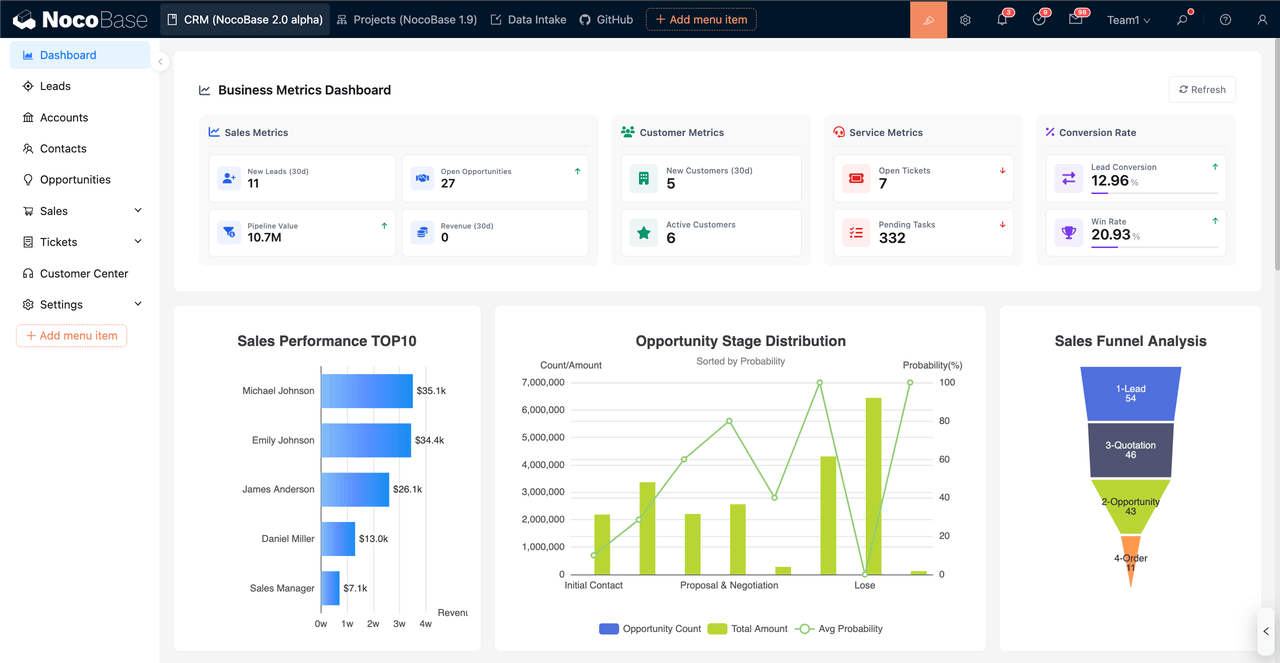
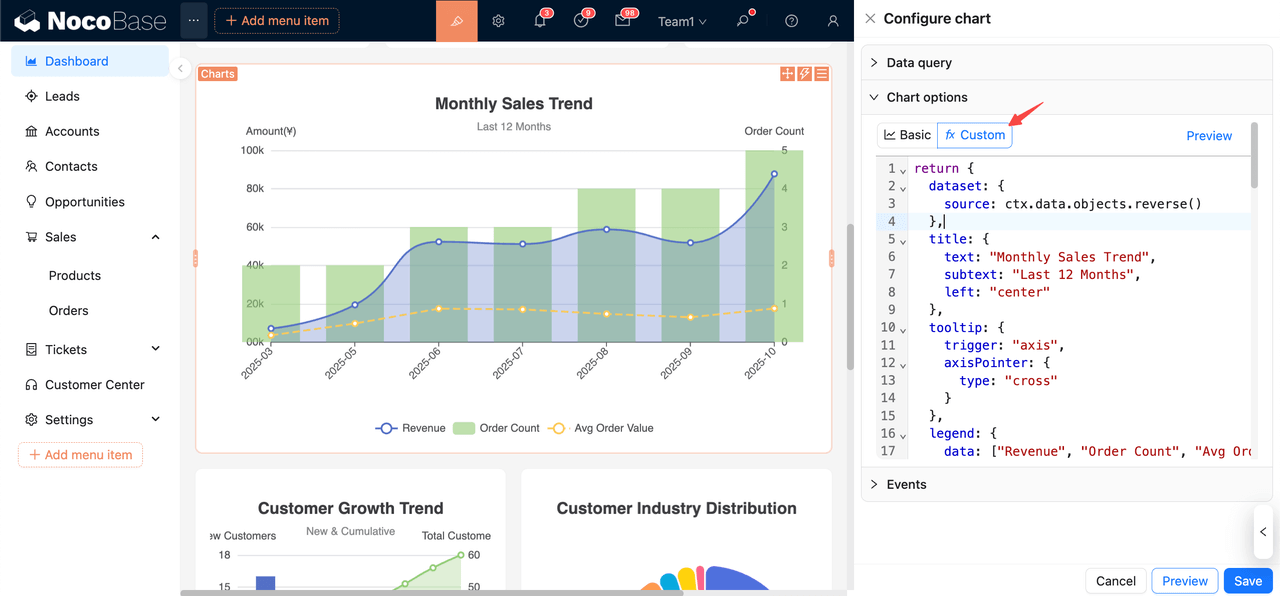
- Building visual dashboards on a unified data model: NocoBase’s visualization capabilities are built on a unified data model. After modeling, business tables, workflow records, and other structured data can be used directly as visualization data sources. Visualization building mainly includes three modes.
- Configure common components such as line charts, bar charts, and statistic cards through chart blocks.
- Implement more flexible custom rendering in JS blocks.
- Use AI employees to automatically generate visual layouts and chart configurations from natural language instructions. Overall, these capabilities support building both standard dashboards and more complex analytical or customized scenarios.
- Plug-based extensibility and system integration: Built on a microkernel architecture, the platform allows on demand extension of page components, action capabilities, and data sources. It can connect to the primary database, external databases, and third party APIs, making it suitable for teams that need to integrate multiple data sources or create custom logic.
AI highlights
- Built in AI Employees: NocoBase provides native AI employee capabilities, where AI employees take on specific visualization generation tasks inside the system. They can analyze designated datasets and automatically build charts, KPI cards, and basic analytical layouts from natural language instructions, reducing manual configuration and improving visualization efficiency. Enterprises can define additional AI employees according to workflow needs, allowing them to extend their role in visualization and analytical tasks.
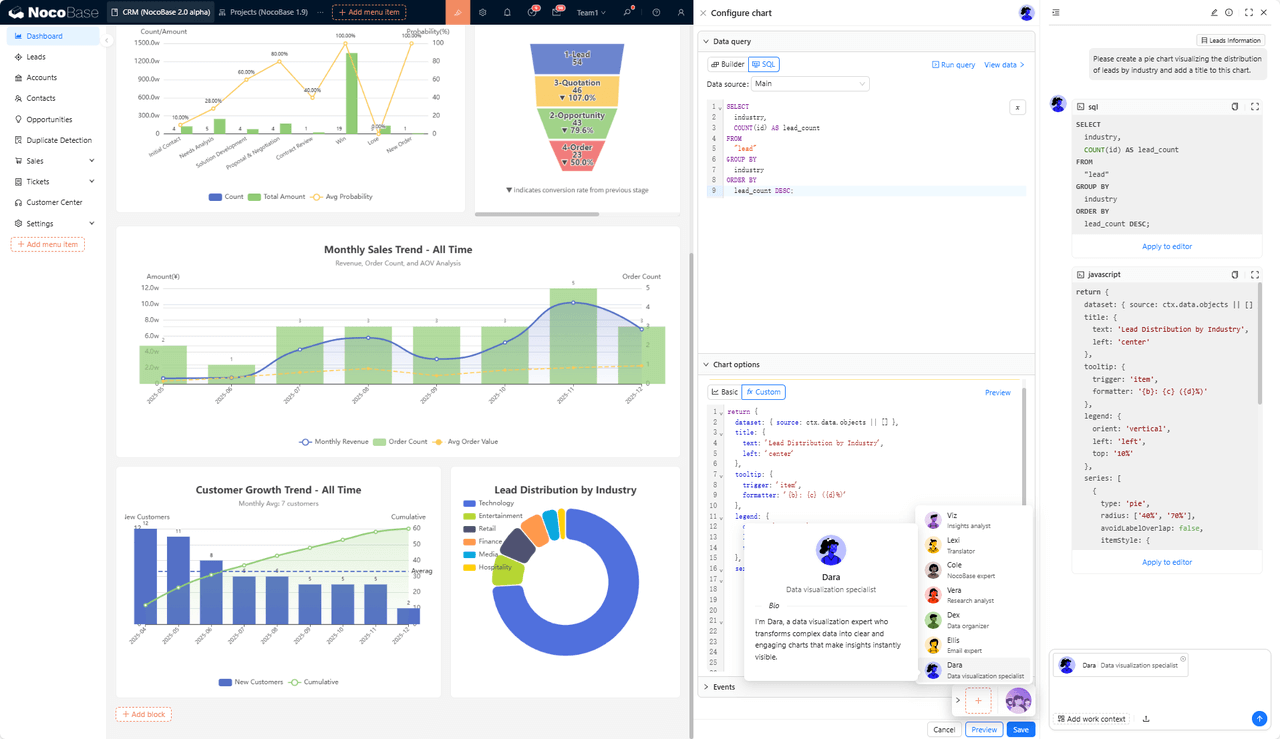
- Integration with knowledge bases and vector databases: AI employees can reference knowledge base content and perform retrieval and matching through vector databases to support explanations, document understanding, or structured outputs. This is useful in scenarios requiring business document or rule based analysis.
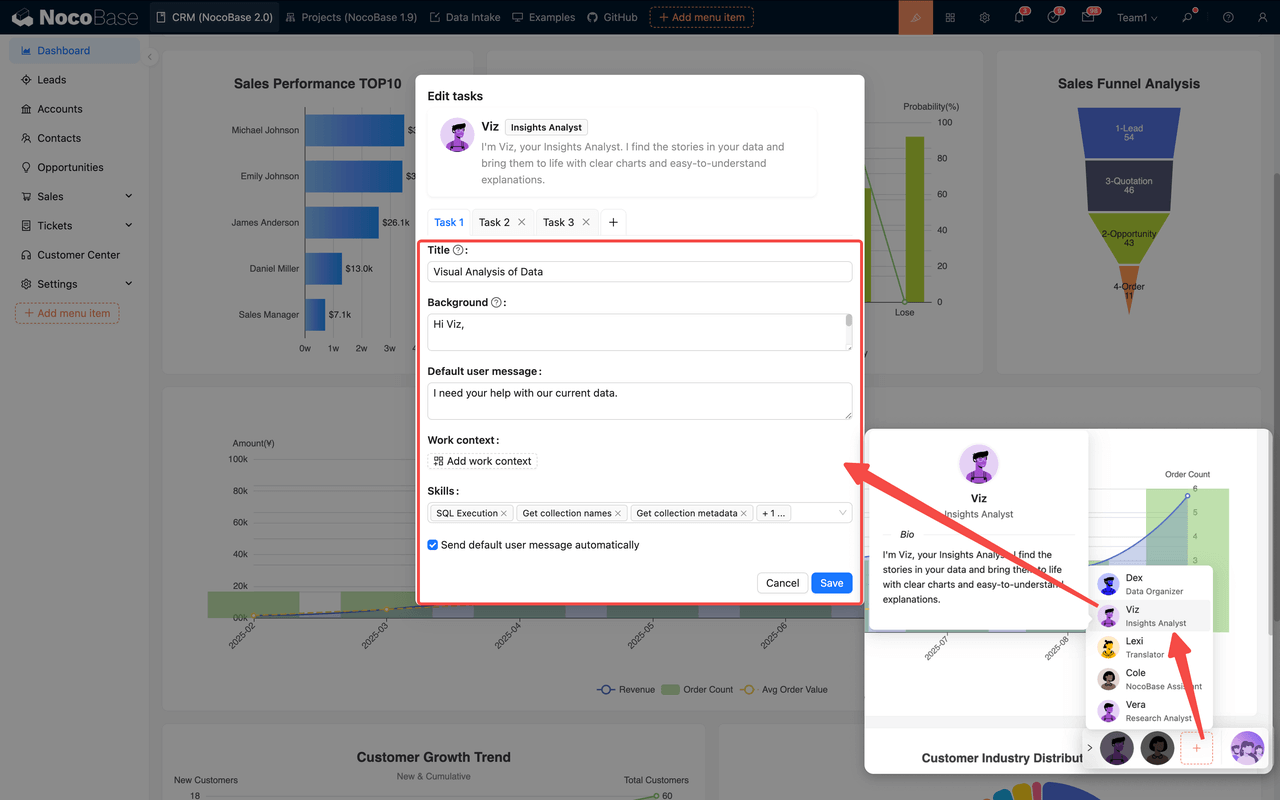
- Support for multiple models and flexible deployment: The platform supports configuring multiple model services, including local and cloud models. Available model options include OpenAI, Gemini, Anthropic, and others. Teams can choose model setups based on security, cost, and runtime environment.
Wren AI

Official site: https://www.getwren.ai/
Documentation: https://docs.getwren.ai/cp/overview
GitHub: https://github.com/Canner/WrenAI
GitHub Stars: 13.2k
Overview
Wren AI is an open source generative BI tool that produces queries, charts, and analytical visuals directly from natural language.
Core uses
- Fast visualization building: It can automatically create charts and starter dashboards from connected data sources, making it suitable for operations dashboards and routine metric views.
- Embedding analytics into other systems: Its API based architecture allows teams to integrate generative analytics into existing business applications.
AI highlights
- End to end generative analytics: Wren AI converts natural language into SQL and then into charts or reports, covering the full workflow from Text to SQL to visualization.
- Semantic layer: A built in semantic engine interprets business models and data structures, improving the accuracy of natural language queries and generated charts.
- Model flexibility and self hosting: Supports multiple models such as OpenAI, Gemini, Google AI, and Anthropic, and provides an open source self hosted edition for environments requiring data security or cost control.
Redash
Official site: https://redash.io
Documentation: https://redash.io/help
GitHub: https://github.com/getredash/redash
GitHub Stars: 28.1k
Overview
Redash is an open source SQL based visualization and analytics tool for building charts, query panels, and lightweight BI dashboards. It is widely used by data teams for self service analytics.
Core uses
- SQL driven dashboards: Users write SQL to query data and build charts, tables, and metric cards from the results, then combine them into dashboards. Ideal for teams comfortable with SQL.
- Integrating multiple data sources: It supports PostgreSQL, MySQL, BigQuery, Athena, and many other databases or APIs, making it easy to unify enterprise data into a simple analysis layer.
AI-related features
Although Redash does not include native AI features, its SQL and API centric design integrates well with external AI tools.
- Text to SQL using external LLMs: By connecting services such as OpenAI or Anthropic, AI can generate SQL from user descriptions and feed it directly into Redash.
- AI outputs as data sources: AI generated JSON, tabular results, or aggregated metrics can be treated as API data sources and visualized within Redash.
Appsmith
Official site: https://www.appsmith.com/
Documentation: https://www.appsmith.com/ai/low-code
GitHub: https://github.com/appsmithorg/appsmith
GitHub Stars: 38.6k
Overview
Appsmith is an open source platform for visually building applications. It can be used to create business dashboards and lightweight visual panels, supported by a component library, data connections, and flexible UI configuration. It is well suited for internal systems focused on data display, business monitoring, and operational workflows.
Core uses
- Building dashboards and visual panels: Teams can present data from databases or APIs using charts, tables, and list components. This supports operations monitoring, business reporting, and simple metric displays, with the flexibility to customize interactions and layout.
- Building internal tools and admin applications: With its UI components, permission controls, and action logic, Appsmith supports data display, entry, and workflow handling within a single application. It is ideal for operation-heavy or data-centric internal processes.
AI highlights
- AI Assistant for faster application creation: The assistant generates layouts, components, API requests, and basic logic from natural language prompts, helping reduce manual UI configuration and speeding up development.
- Logic and content generation support: AI can produce script snippets for queries or formatting logic and generate explanatory text when needed, improving content creation efficiency.
Metabase
Official site: https://www.metabase.com/
Documentation: https://www.metabase.com/docs/latest/
GitHub: https://github.com/metabase/metabase
GitHub Stars: 44.9k
Overview
Metabase is a widely adopted open source BI platform designed for enterprise analytics dashboards and self service data exploration.
Core uses
- Visual exploration and reporting: Users explore data by forming questions, visualizing results, and assembling dashboards, often without writing SQL. It supports charts, tables, filters, and shared dashboards for KPI tracking, trend analysis, user behavior studies, and sales insights.
- Teamwide sharing and collaboration: Reports and dashboards can be shared, edited, or subscribed to across teams, enabling coordinated analysis and centralized tracking of key metrics.
- Broad data connectivity: Metabase connects to many popular databases, making it easy to bring dispersed enterprise data into a unified analysis layer.
AI highlights
- Metabot AI assistant: The built-in Metabot helps interpret metrics, generate insights, and respond to data questions.
- Natural language queries: Users can ask questions in plain language, and Metabase will attempt to return relevant data or visualizations.
- Automated insights: Metabot provides explanations and context when data changes or when results are generated, helping users understand the meaning behind metrics.
Grafana
Official site: https://grafana.com
Documentation: https://grafana.com/docs
GitHub: https://github.com/grafana/grafana
GitHub Stars: 71.2k
Overview
Grafana is an open source platform for visualization and monitoring. It is built around time series and observability data, and is also widely used for business metrics and dashboard creation.
Core uses
- Real time monitoring and metric visualization: Grafana connects to time series databases, log services, and monitoring tools to display data as charts, trends, and metric cards. It supports system monitoring, service performance tracking, and real time business analysis.
- Unified views across multiple data sources: With support for sources such as Prometheus, Elasticsearch, MySQL, PostgreSQL and BigQuery, Grafana lets teams combine heterogeneous data into a single dashboard for consolidated monitoring and operations views.
AI-related features
Grafana does not include native AI features, but its plugin system and API based data sources make AI integration straightforward:
- Anomaly detection and trend analysis with external AI: Outputs from AIOps tools or AI services can be brought into Grafana to highlight anomalies or shifts in trends and assist with diagnostics.
- Using AI generated data as a source: Insights or structured outputs from AI models can be fed into Grafana through an API source and visualized like any other dataset.
Closing notes
Commercial BI tools remain reliable choices for enterprise analytics, but considerations such as licensing, deployment constraints, and extensibility lead many teams to explore open source alternatives. When budgets are limited or customization is important, open source tools often provide more flexibility and support gradual, iterative adoption.
From the six tools discussed:
- For lightweight dashboards with minimal upkeep, Redash, Grafana, or Wren AI are strong candidates.
- For platforms that combine business applications, data management, and analytics, NocoBase, Appsmith, or Metabase are better aligned.
👉Quick start guide: Quickly Build a Core App Dashboard with NocoBase
These ecosystems continue to evolve, allowing teams to refine their stack over time. If you are using or evaluating any of these tools, we welcome your insights and experience.
Related reading:
- The 8 Best Google Sheets Alternatives (Specs & Pricing)
- 6 Open-Source No/Low-Code Tools for Building PoCs
- A Developer’s Technical Decision Guide to No-Code and Low-Code (2026)
- 6 In-Depth Comparison of RBAC in Enterprise-Grade No-Code/Low-Code Platforms
- 14 AI-Powered Low-Code Platforms on GitHub Worth Watching
- Top 11 Open Source No-Code AI Tools with the Most GitHub Stars
- Top 18 Open Source AI Agent Projects with the Most GitHub Stars