Construa com o seu agente de IA
用 NocoBase 搭建一个应用 —— 人力资源分析看板: 核心人力指标、组织结构图表和 HR 分析报告。布局和标志性视觉参照这个原型:https://static-docs.nocobase.com/solution/templates/39-hr-analytics.html
O link do protótipo (HTML) no prompt é um design que preparamos previamente, apenas para demonstrar a capacidade; o NocoBase não recomenda gerar um sistema inteiro a partir de um único prompt. Ao construir com ele, combine-o com a skill “prototype reproduction” (nocobase-prototype-repro) das NocoBase Skills para obter um bom resultado.
Antes de começar, siga o início rápido do agente de IA para instalar o NocoBase e conectar o seu agente. Os resultados de IA podem variar; dependendo do modelo e da complexidade do sistema, alguns ajustes ou rodadas adicionais podem ser necessários.
Introduction
An HR analytics dashboard is designed to centralize workforce structure, employee changes, attrition, and organizational health. HR and management teams can view headcount, net growth, attrition rate, average tenure, headcount gap, and regrettable attrition from one dashboard.
The page supports filtering by department, employment type, employee status, and job level. After filtering, metric cards and charts update around the selected scope, helping teams analyze a specific department, job level, or employee group.
The dashboard includes headcount trends, hiring and termination comparisons, department headcount, gender distribution, tenure distribution, department-level attrition, and recent departures. The employee table can also record employee ID, department, job level, employment type, status, tenure in months, and performance rating.
With the help of an AI Agent, teams can generate HR analysis reports based on employee data, covering workforce structure, turnover risk, performance distribution, salary distribution, and improvement suggestions. The reports can support HR reviews, management updates, and organizational health checks.
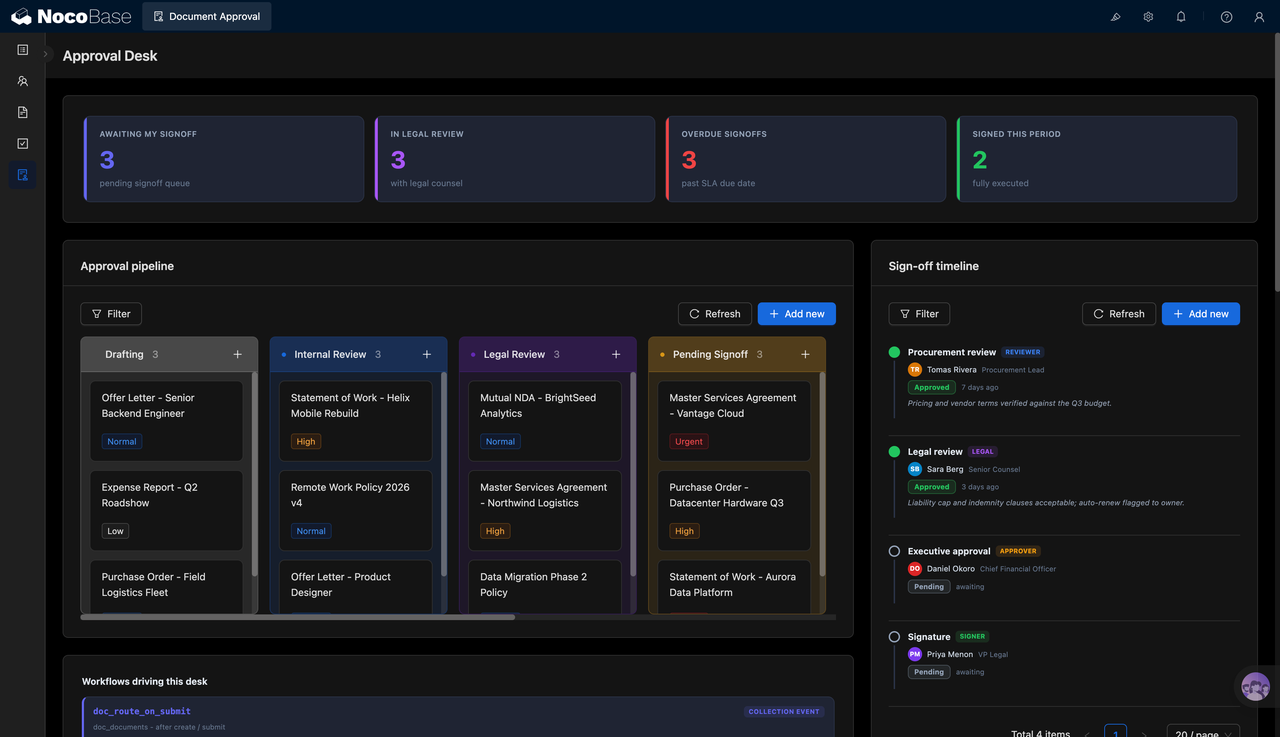
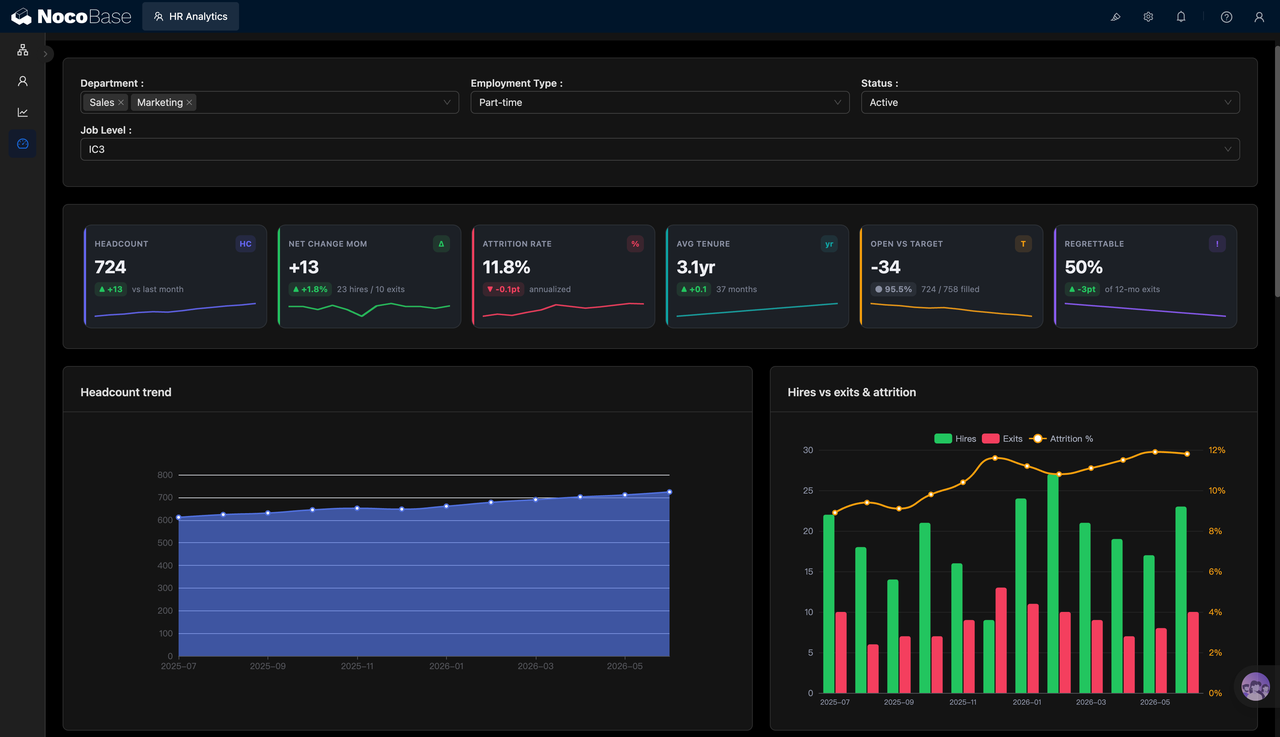
Key HR metrics and trend charts:
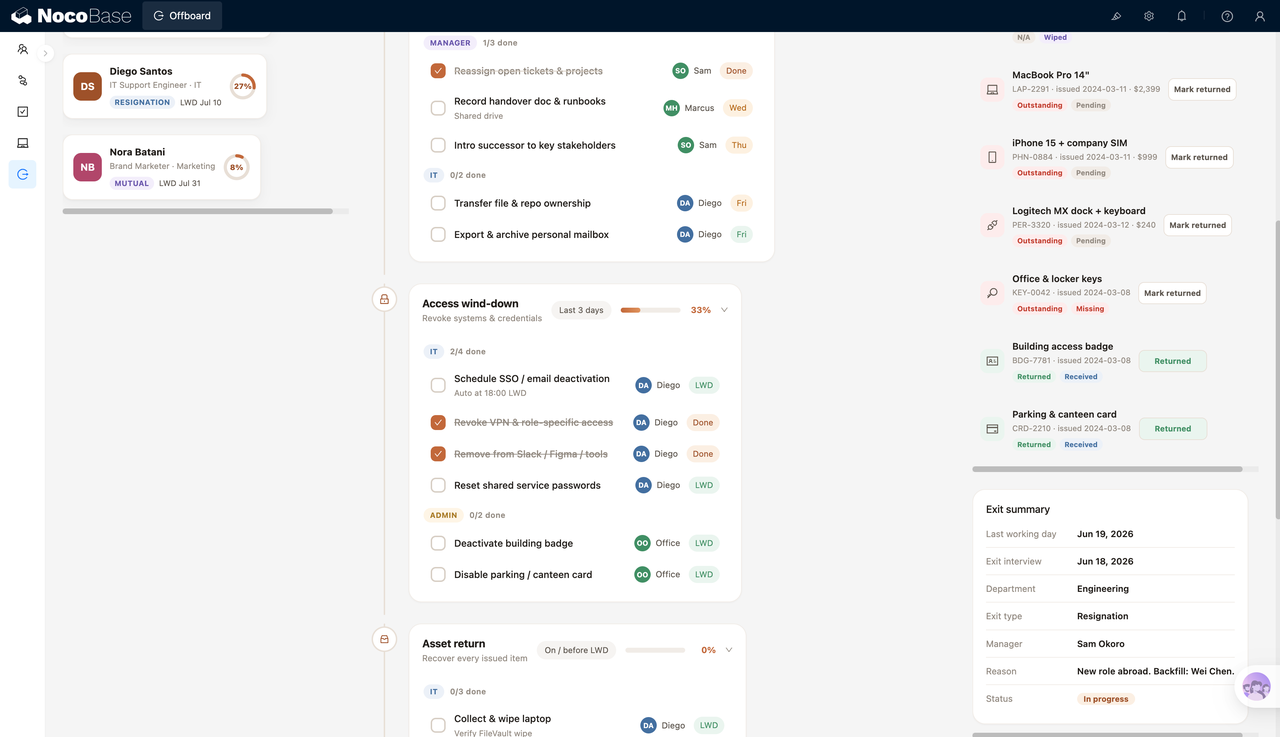
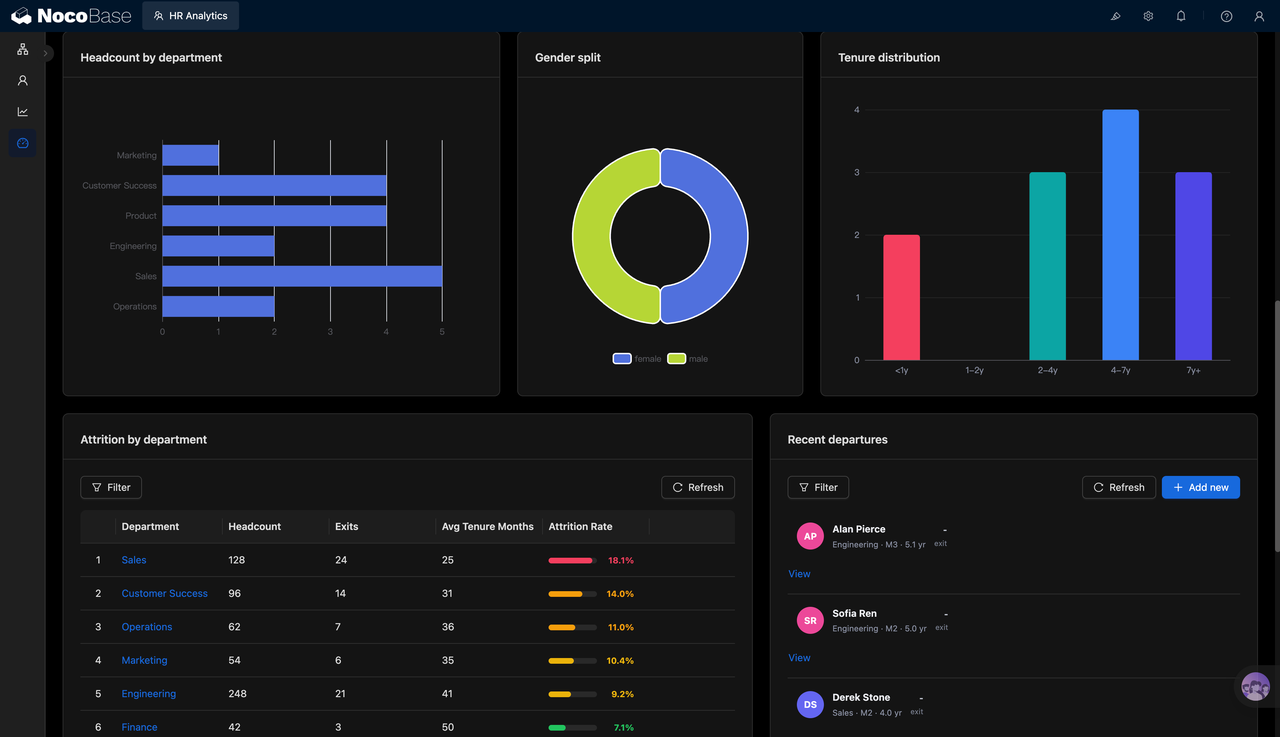
Analyze department headcount, gender distribution, and tenure distribution:
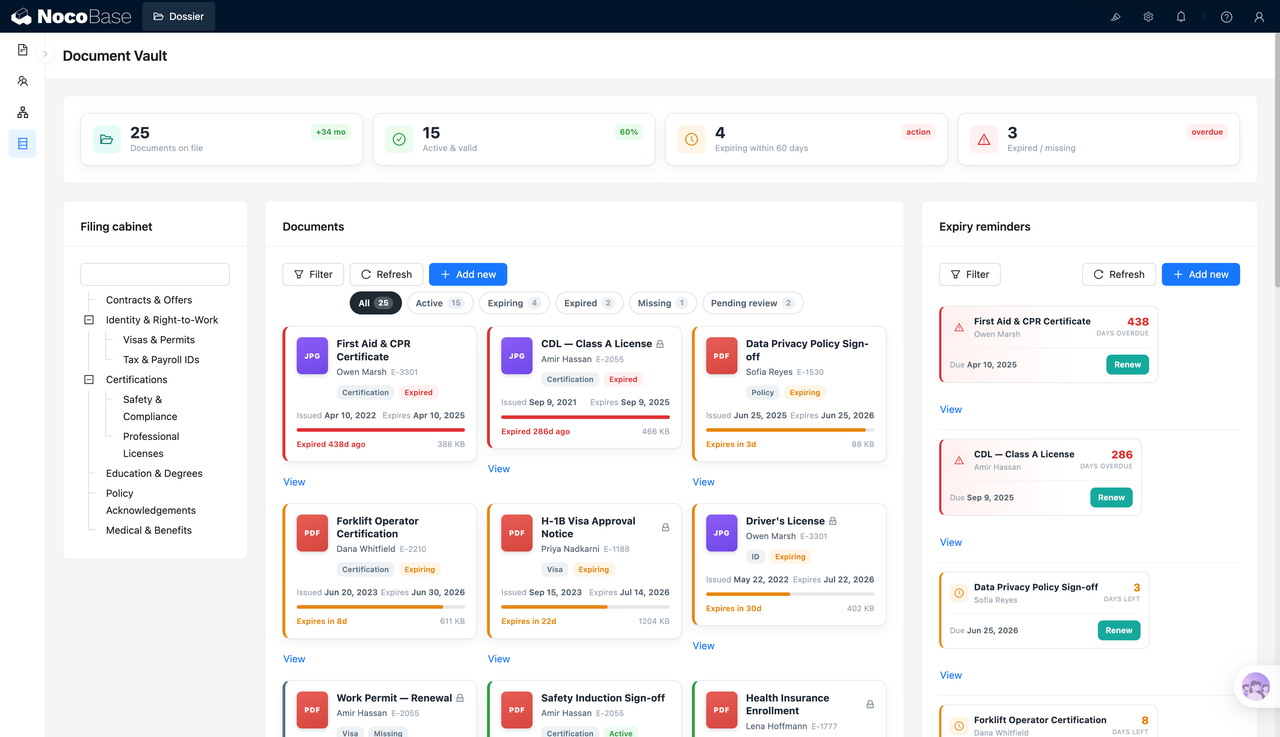
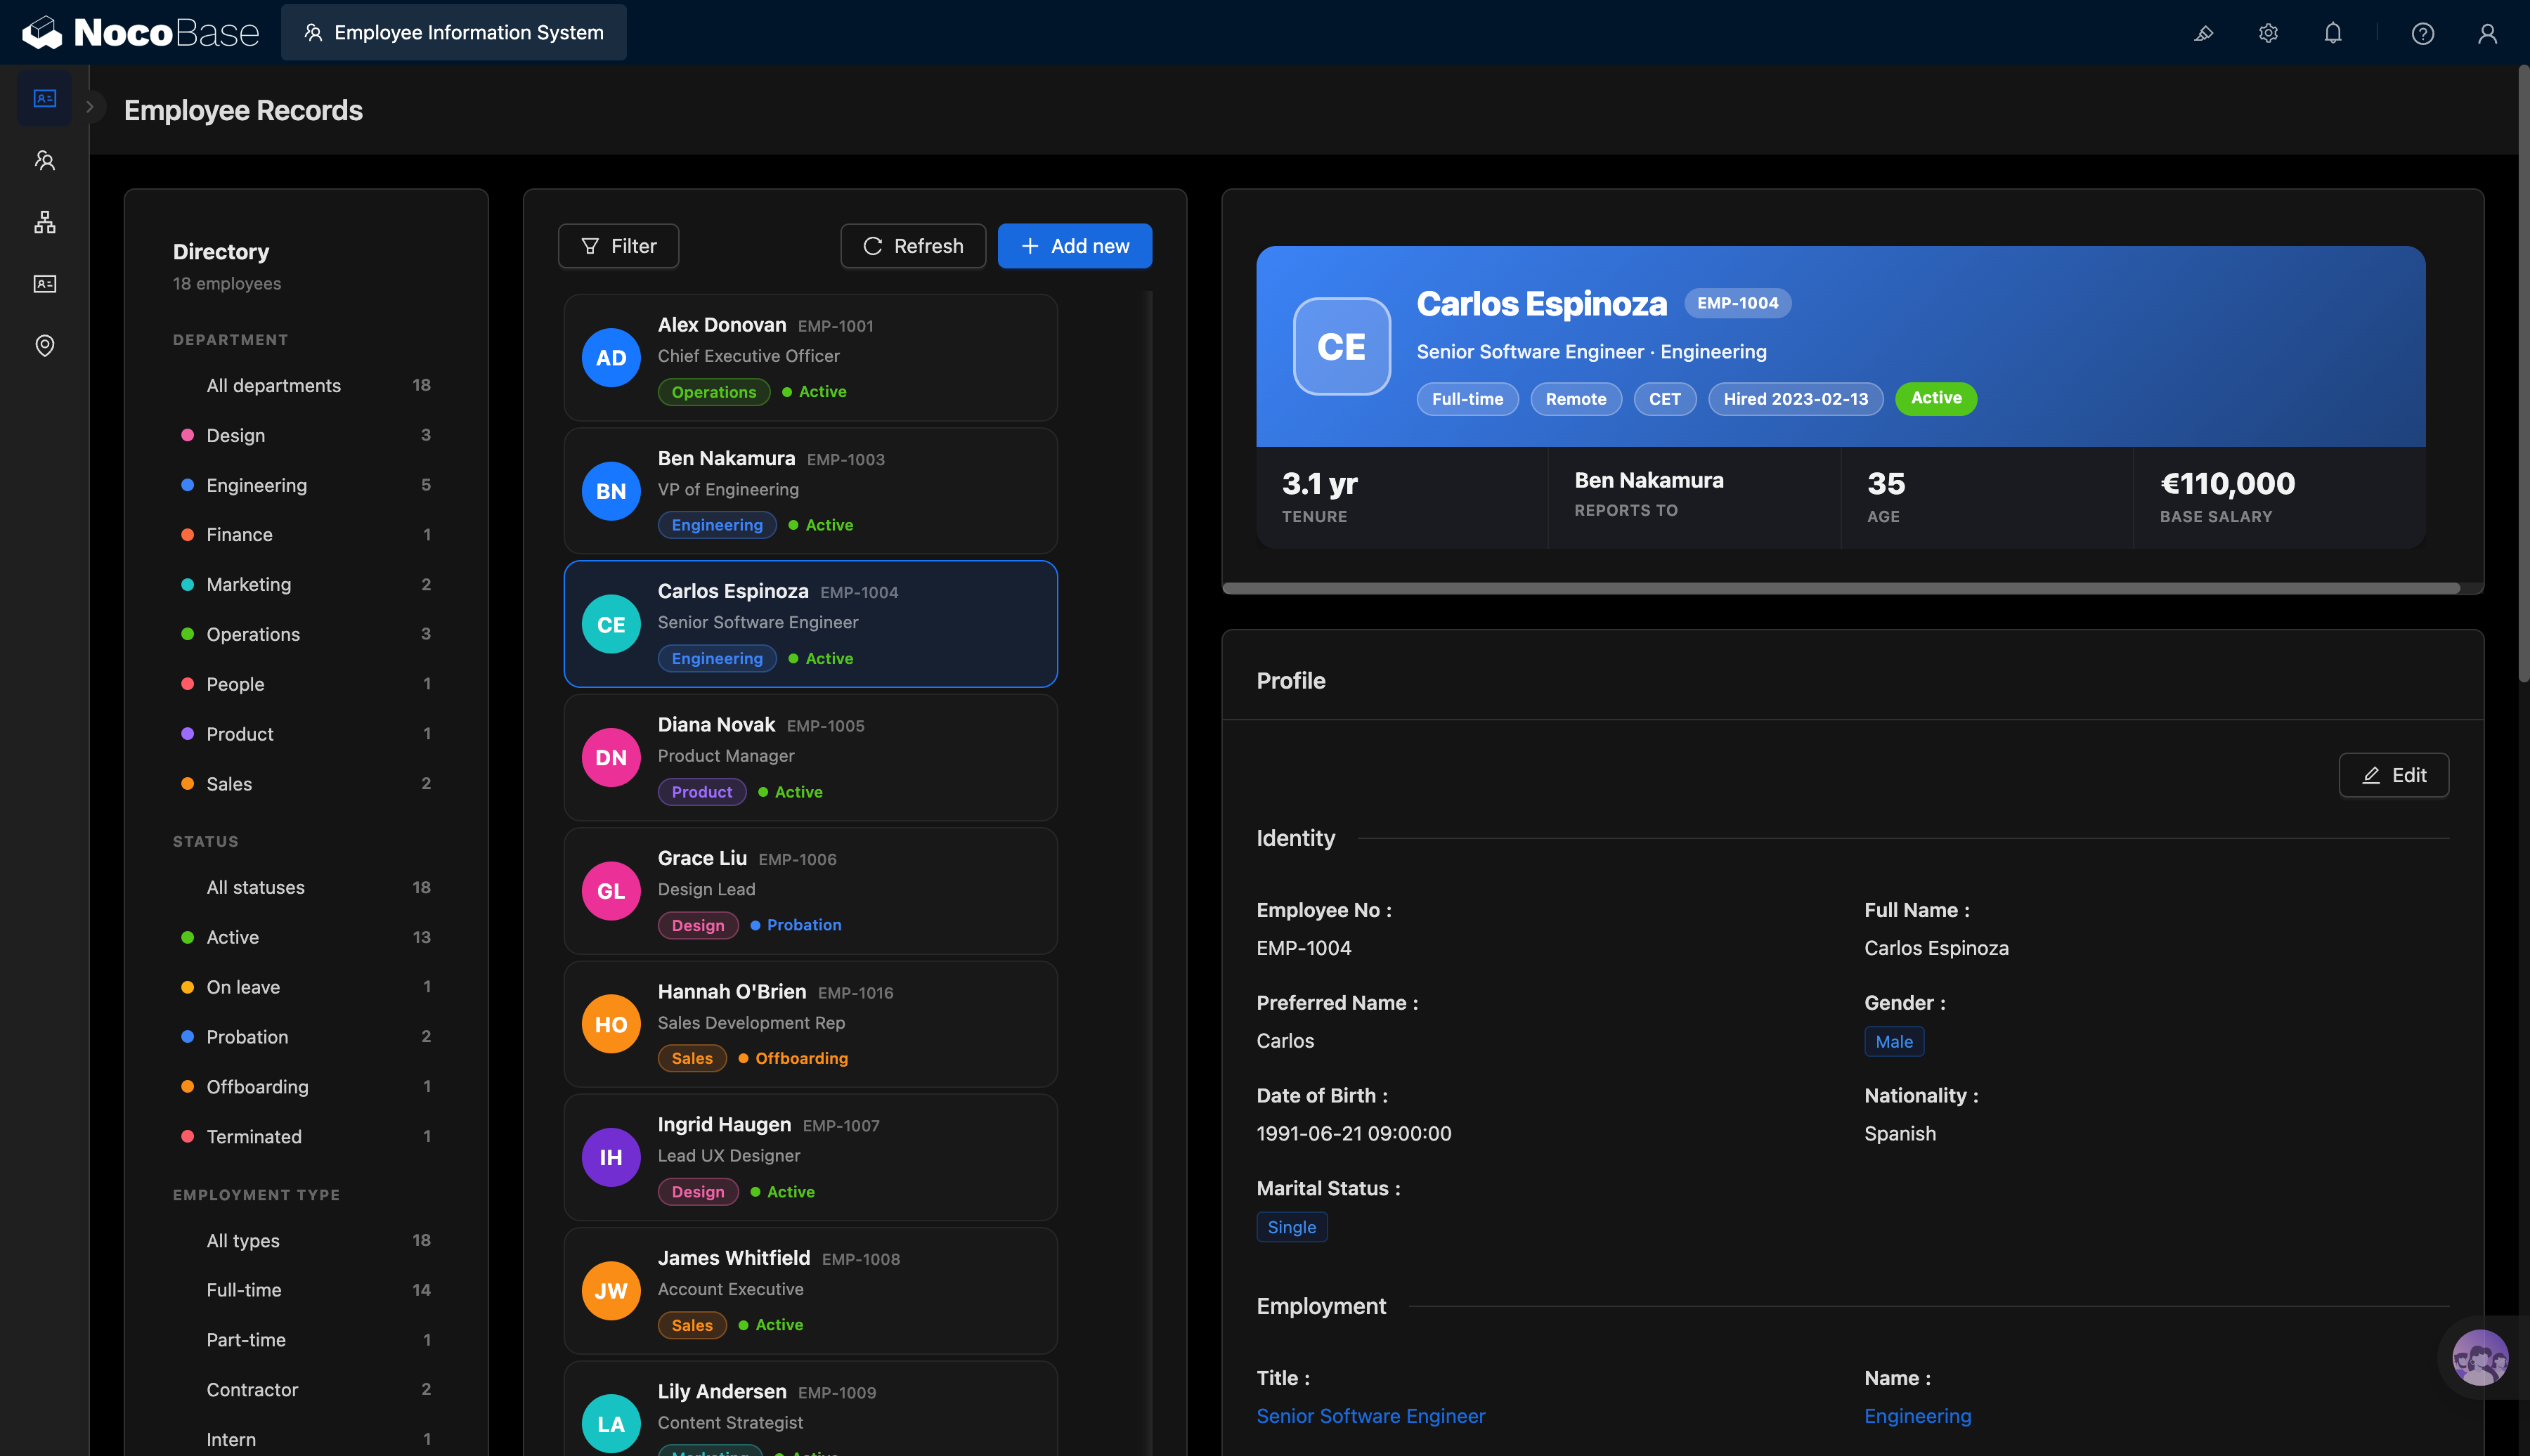
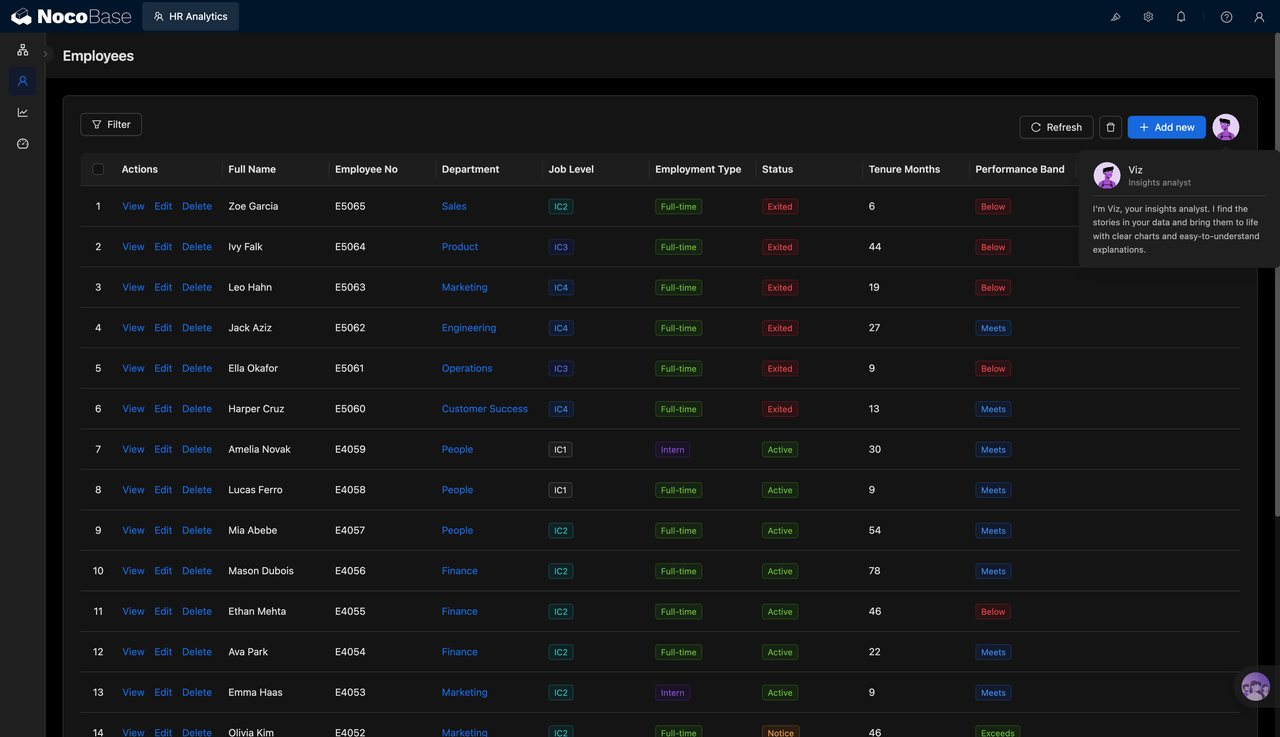
Employee table records status, tenure, and performance ratings:
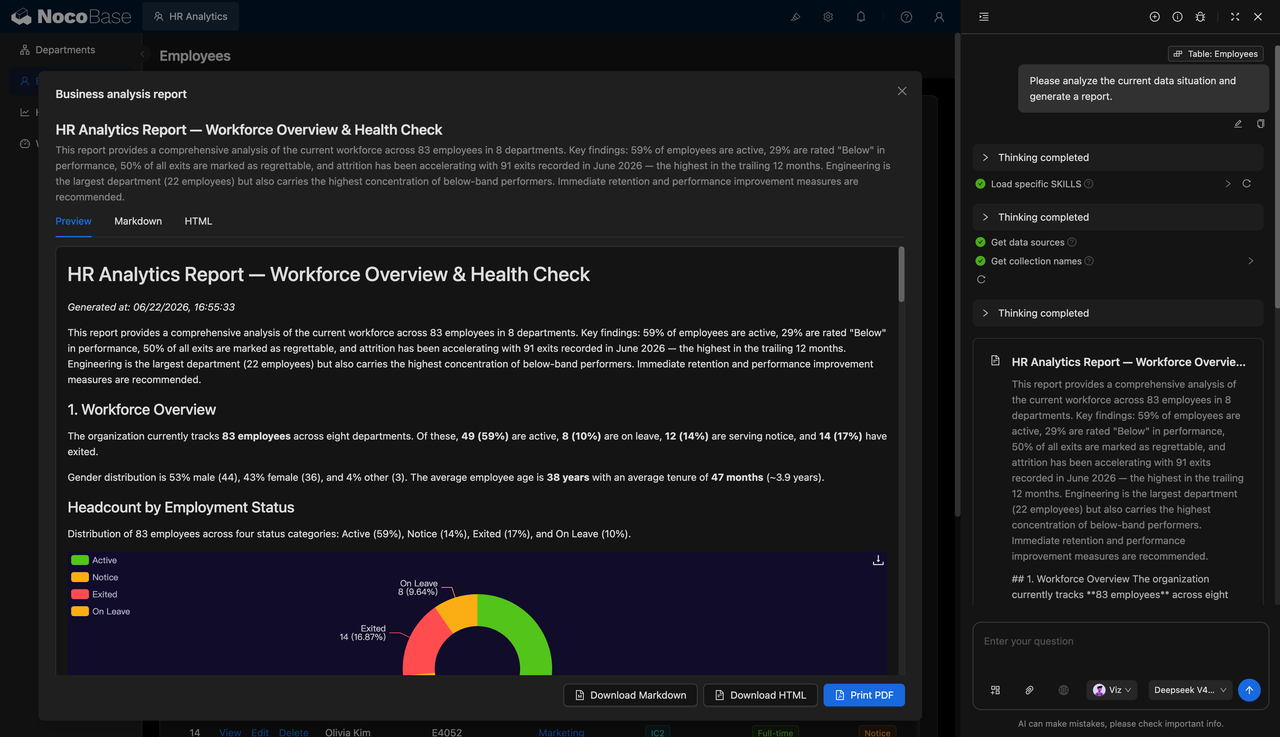
AI-generated HR health check report:
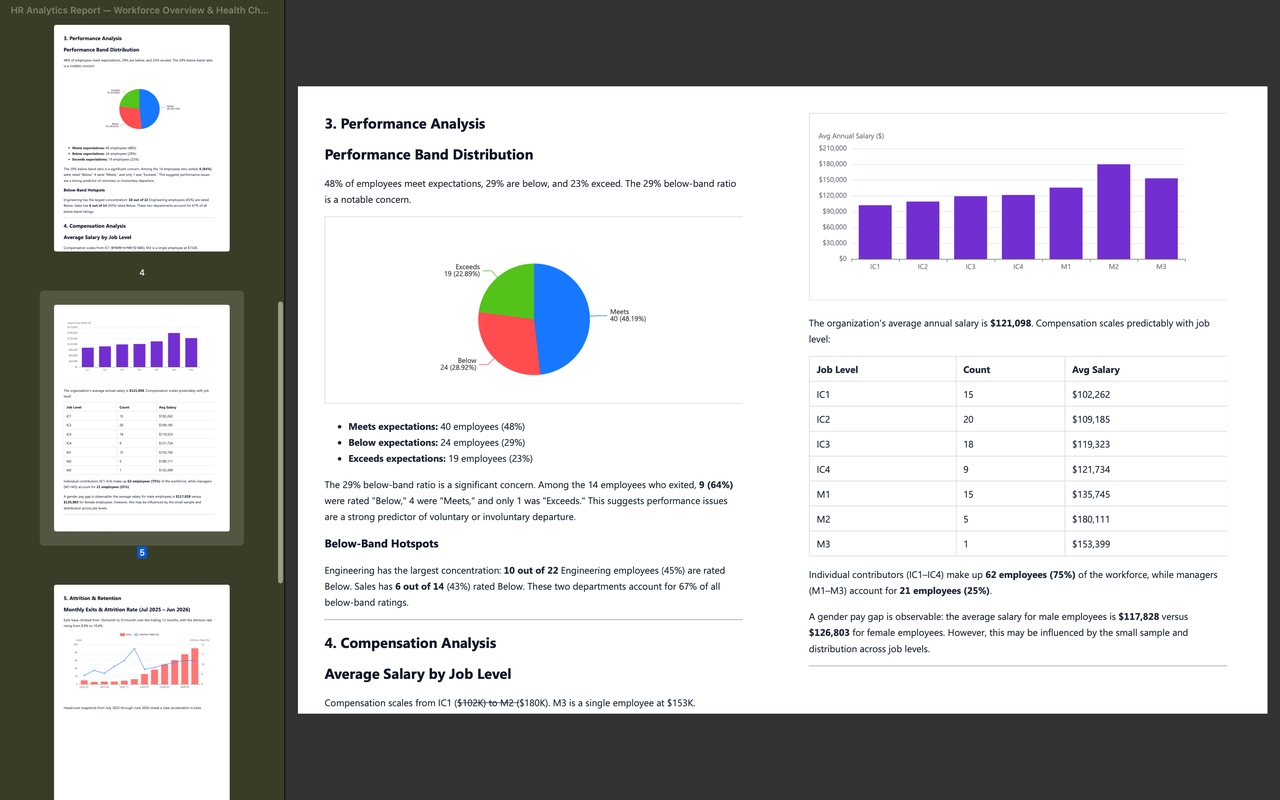
PDF report analyzes performance distribution and salary structure:
What Problems Can an HR Analytics Dashboard Solve?
When HR data is scattered across employee spreadsheets, recruitment records, termination records, and performance files, management teams struggle to understand the current state of the organization quickly. They often need to repeatedly prepare data to answer questions such as whether headcount is growing, which departments have higher attrition, which employees have left, and whether low performance is concentrated in certain groups.
HR analysis first needs a clear scope. For example, after filtering by Sales and Marketing departments, part-time employees, active status, and IC3 level, the team can focus on the size, movement, and risks of this specific employee group instead of reviewing company-wide totals every time.
Core metrics help HR teams evaluate organizational changes quickly. Bringing headcount, monthly net change, annualized attrition, average tenure, headcount gap, and regrettable attrition into one view makes it easier to identify growth, attrition, and workforce structure issues.
AI reports can turn charts and detailed records into conclusions that are easier for management to read. For example, a report can summarize how many of 83 employees are active, on leave, in notice period, or terminated, which departments have the largest headcount, where low performers are concentrated, and whether attrition is accelerating.
Key Features
Core HR Metrics Dashboard
- Headcount: Shows the employee size within the selected scope, such as 724 employees.
- Attrition rate: Displays annualized attrition, such as 11.8%, to evaluate workforce stability.
- Average tenure: Shows average employment duration, such as 3.1 years or 37 months.
- Headcount gap: Shows the gap between current headcount and the target headcount, such as -34.
Organization Structure Analysis
- Department headcount: Shows headcount distribution across departments such as Sales, Product, Engineering, and Operations.
- Gender distribution: Uses a donut chart to show employee gender composition.
- Tenure distribution: Shows employees across tenure ranges, such as under 1 year, 2–4 years, 4–7 years, and over 7 years.
- Structure review: Helps HR identify whether certain departments or tenure groups are overly concentrated.
- Organizational health reference: Combines headcount, tenure, and attrition data to evaluate organizational stability.
Employee Detail Table
- Basic information: Shows employee name and employee ID.
- Organization information: Shows department, job level, and employment type.
- Employee status: Records active, terminated, notice period, and other status values.
- Tenure information: Shows tenure in months to support employment cycle analysis.
- Performance rating: Displays performance statuses such as Meets, Below, and Exceeds.
AI HR Analysis Report
- Attrition analysis: Identifies accelerated attrition, regrettable attrition, and high-risk departments.
- Performance analysis: Analyzes the distribution of Meets, Below, Exceeds, and other performance ratings.
- Salary analysis: Analyzes average annual salary and salary structure by job level.
- Key recommendations: Provides suggestions for retention, performance improvement, and organizational adjustment.
Why Build an HR Analytics Dashboard with AI and NocoBase?
An HR analytics dashboard needs to cover employee data, department structure, employment type, employee status, job level, tenure, performance rating, hiring and termination changes, and management reports. It helps HR teams, department owners, and executives continuously assess workforce size, organizational structure, and attrition risks.
HR data changes as recruitment, departures, transfers, performance reviews, and organization adjustments happen. If the dashboard remains a static chart page, it will quickly become hard to maintain: departments, job levels, and employee statuses need continuous updates; hiring and termination data must be summarized by month; performance and tenure should connect back to employee details; and management teams often request new reporting definitions.
NocoBase can serve as the business foundation for an HR analytics dashboard by connecting employee profiles, department structures, status changes, performance data, hiring and termination records, and permission scopes. It provides enterprise application capabilities such as data models, access control, workflows, operation history, audit logs, notifications, single sign-on, page building, and plugin extensions. AI can help generate the initial dashboard, charts, employee tables, and HR analysis reports to reduce repetitive setup work.
Teams can first use AI to create metric dashboards, trend charts, department analysis, employee tables, and HR reports, then continue adjusting fields, filters, chart definitions, permission scopes, and report content in NocoBase. This makes the dashboard more suitable for long-term use, helping teams track workforce size, identify structural changes, detect attrition risks, and support organizational decisions.
FAQ
1.Can the HR analytics dashboard show the overall employee situation?
Yes. The system can show headcount, monthly net change, attrition rate, average tenure, headcount gap, and regrettable attrition.
2.Does the system support filtering by department?
Yes. The screenshots show department filters, such as Sales and Marketing.
3.Does the system support filtering by employment type?
Yes. It can filter employee data by employment types such as part-time.
4.Does the system support filtering by employee status?
Yes. The screenshots show filtering by active status, and the employee table can also record terminated and notice period statuses.
5.Does the system support analysis by job level?
Yes. The screenshots show filtering by levels such as IC3, and job level can also be recorded in employee details.
6.Can the system show headcount trends?
Yes. The dashboard includes a headcount trend chart that shows changes in employee size over time.
7.Can the system analyze hiring and termination changes?
Yes. The system can use hiring, termination, and attrition charts to analyze monthly workforce inflow and outflow.
8.Can the system show department headcount distribution?
Yes. The dashboard can display headcount by department, such as Sales, Customer Success, Product, Engineering, and Operations.
9.Does the system support tenure distribution analysis?
Yes. The system can show employee distribution by tenure ranges, such as under 1 year, 2–4 years, 4–7 years, and over 7 years.
10.Can the system analyze department attrition rates?
Yes. The department attrition table can show department headcount, terminated employees, average tenure, and attrition rate.
11.Can the system show recent departures?
Yes. The right-side list can show recently departed employees with department, job level, and tenure information.
12.Does the system support employee detail management?
Yes. The employee table can show name, employee ID, department, job level, employment type, status, tenure in months, and performance rating.
13.Can AI generate HR analysis reports?
Yes. AI can generate HR analysis reports based on employee data, summarizing workforce structure, attrition risks, performance distribution, and salary analysis.
14.Can AI reports be exported?
Yes. The screenshots show Markdown, HTML, and PDF output, making reports suitable for management updates and internal archiving.
15.Can Claude Code, Codex, Cursor, or OpenCode help build this system?
Yes. These AI Agents can connect to NocoBase to help generate metric dashboards, charts, employee tables, and analysis reports, which can then be adjusted in NocoBase.
16.How is this different from building with pure Vibe Coding?
Pure Vibe Coding is better for quickly generating chart prototypes. NocoBase is better for managing employee data, permissions, filter definitions, metric updates, report output, and long-term iteration.
17.Does the system support access control?
Yes. Access control can be configured in NocoBase. For example, HR can view employee details, department managers can view data for their own teams, and executives can view summary dashboards and reports.
18.Can metrics and chart definitions be adjusted later?
Yes. Employee fields, filters, department dimensions, attrition definitions, chart configuration, and report content can all be adjusted over time.
19.Is this system suitable for formal enterprise use?
Yes. NocoBase can support employee data, pages, permissions, and analytics views, while AI reduces setup and report preparation work. This makes the system suitable for long-term maintenance and iteration.