Xây dựng hệ thống bằng AI agent của bạn
Build a NocoBase app — Employee Satisfaction Survey System: an eNPS gauge, a dimension heatmap, and a grid of feedback cards. Match the layout and signature visuals of this reference prototype: https://static-docs.nocobase.com/solution/templates/14-satisfaction-survey.html
Liên kết nguyên mẫu (HTML) trong prompt là thiết kế chúng tôi chuẩn bị sẵn, chỉ nhằm minh họa khả năng; NocoBase không khuyến nghị tạo cả một hệ thống chỉ từ một câu prompt. Khi xây dựng với nó, hãy kết hợp với skill “prototype reproduction” (nocobase-prototype-repro) trong NocoBase Skills để có kết quả tốt.
Trước khi bắt đầu, hãy làm theo hướng dẫn nhanh AI agent để cài đặt NocoBase và kết nối agent của bạn. Kết quả AI có thể khác nhau; tùy vào mô hình và độ phức tạp của hệ thống, có thể cần tinh chỉnh thêm hoặc tương tác nhiều vòng.
Giới thiệu
Sử dụng AI agent yêu thích của bạn cùng với NocoBase để nhanh chóng xây dựng một hệ thống khảo sát mức độ hài lòng nhân viên có thể tùy chỉnh, đáng tin cậy và phát triển liên tục — phân tích eNPS, mức độ hài lòng tổng thể, tỷ lệ phản hồi, mức độ gắn kết nhân viên, các chiều hài lòng khác nhau, khác biệt theo phòng ban và phản hồi câu hỏi mở.
Bạn có thể sao chép prompt bên dưới và để AI agent tạo nền tảng cho hệ thống khảo sát hài lòng trong NocoBase, sau đó điều chỉnh chỉ số, chiều đánh giá, biểu đồ và trang phản hồi thông qua giao diện no-code.
Hệ thống này phù hợp với các kịch bản như khảo sát gắn kết nhân viên, khảo sát hài lòng hàng quý, kiểm tra sức khỏe tổ chức, đánh giá bầu không khí nhóm, phản hồi quản lý, phản hồi về lương thưởng và phúc lợi, cũng như phân tích trải nghiệm nhân viên.
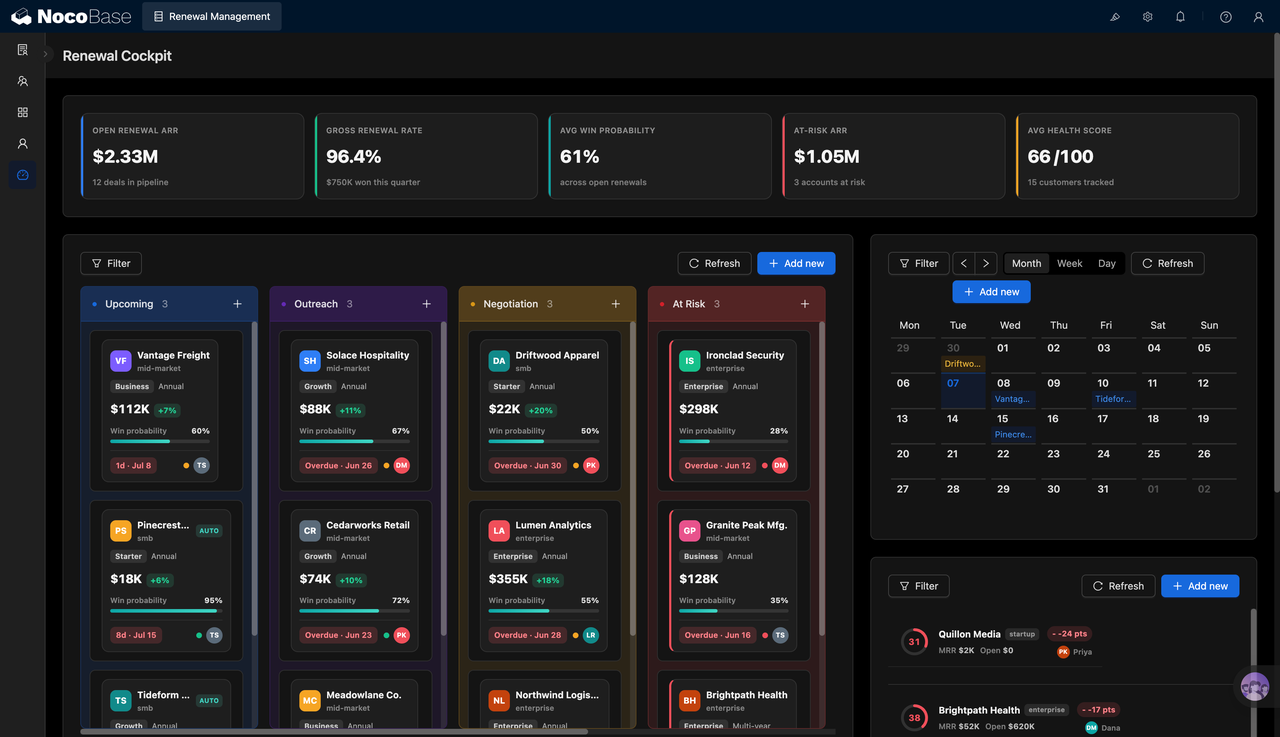
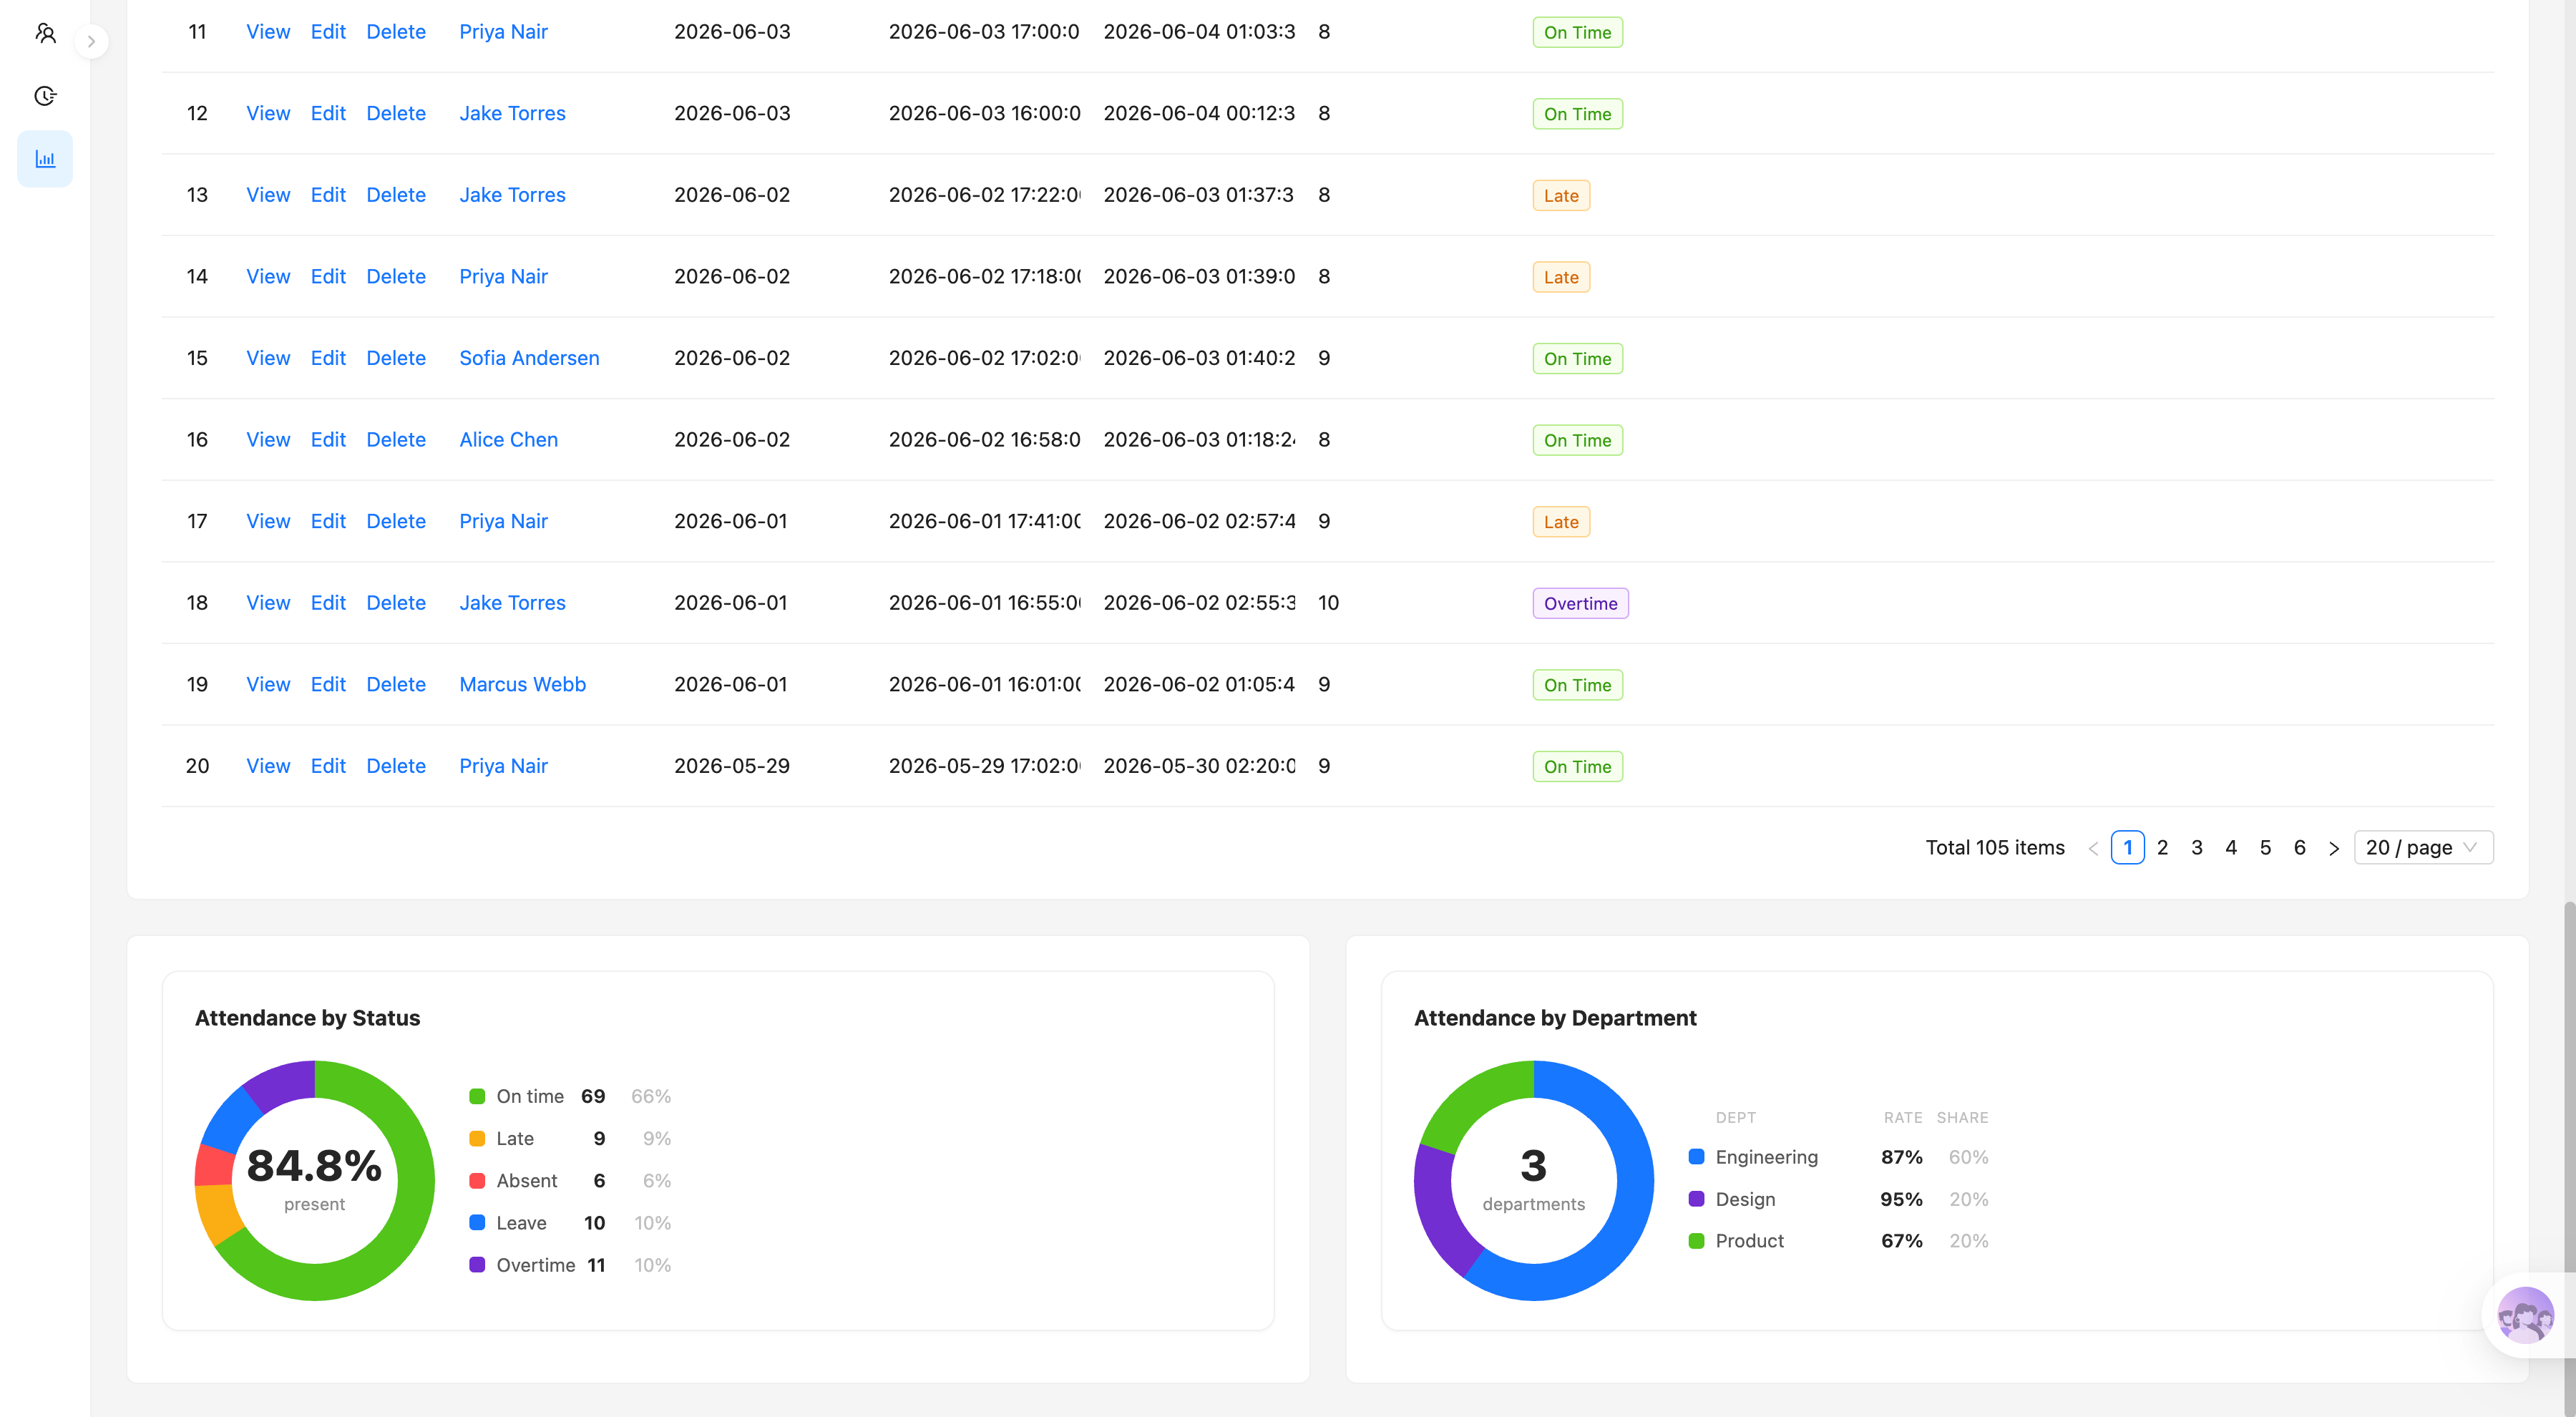
Chỉ số hài lòng cốt lõi và xu hướng:
Bản đồ nhiệt phòng ban và phân bổ cảm xúc câu hỏi mở:
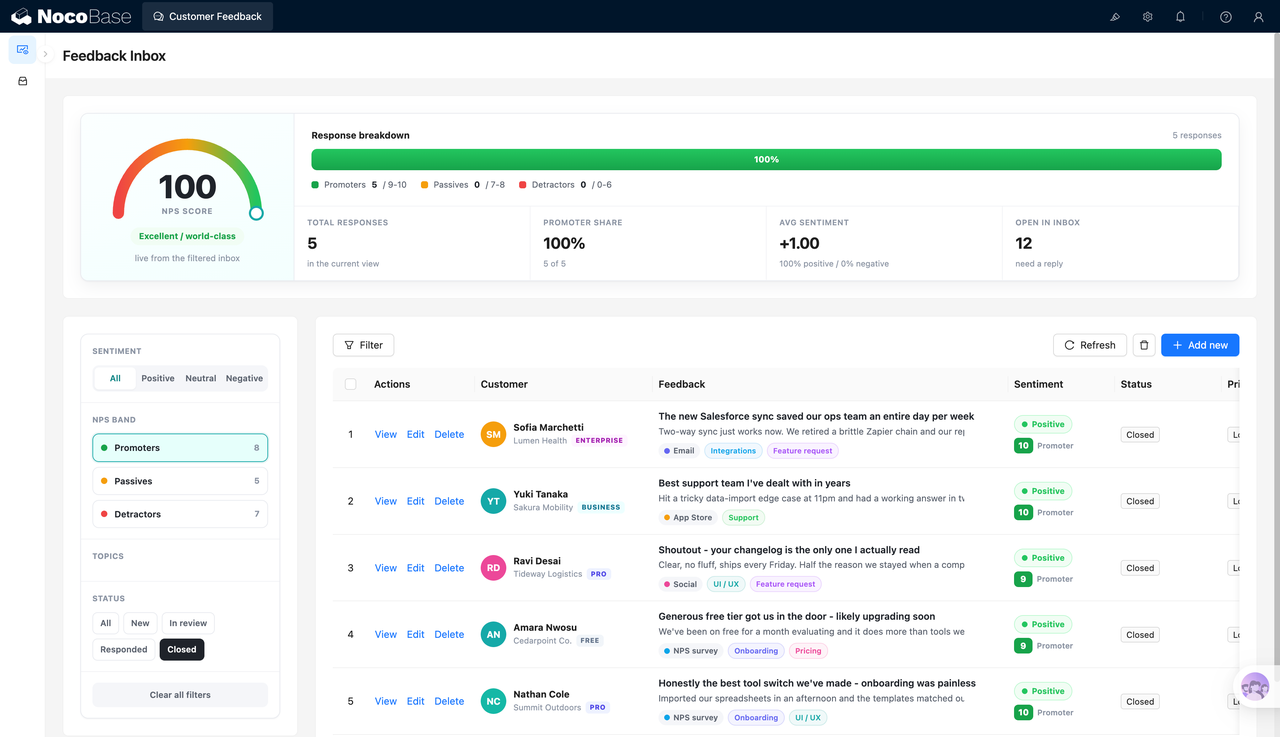
Phản hồi đại diện từ nhân viên:
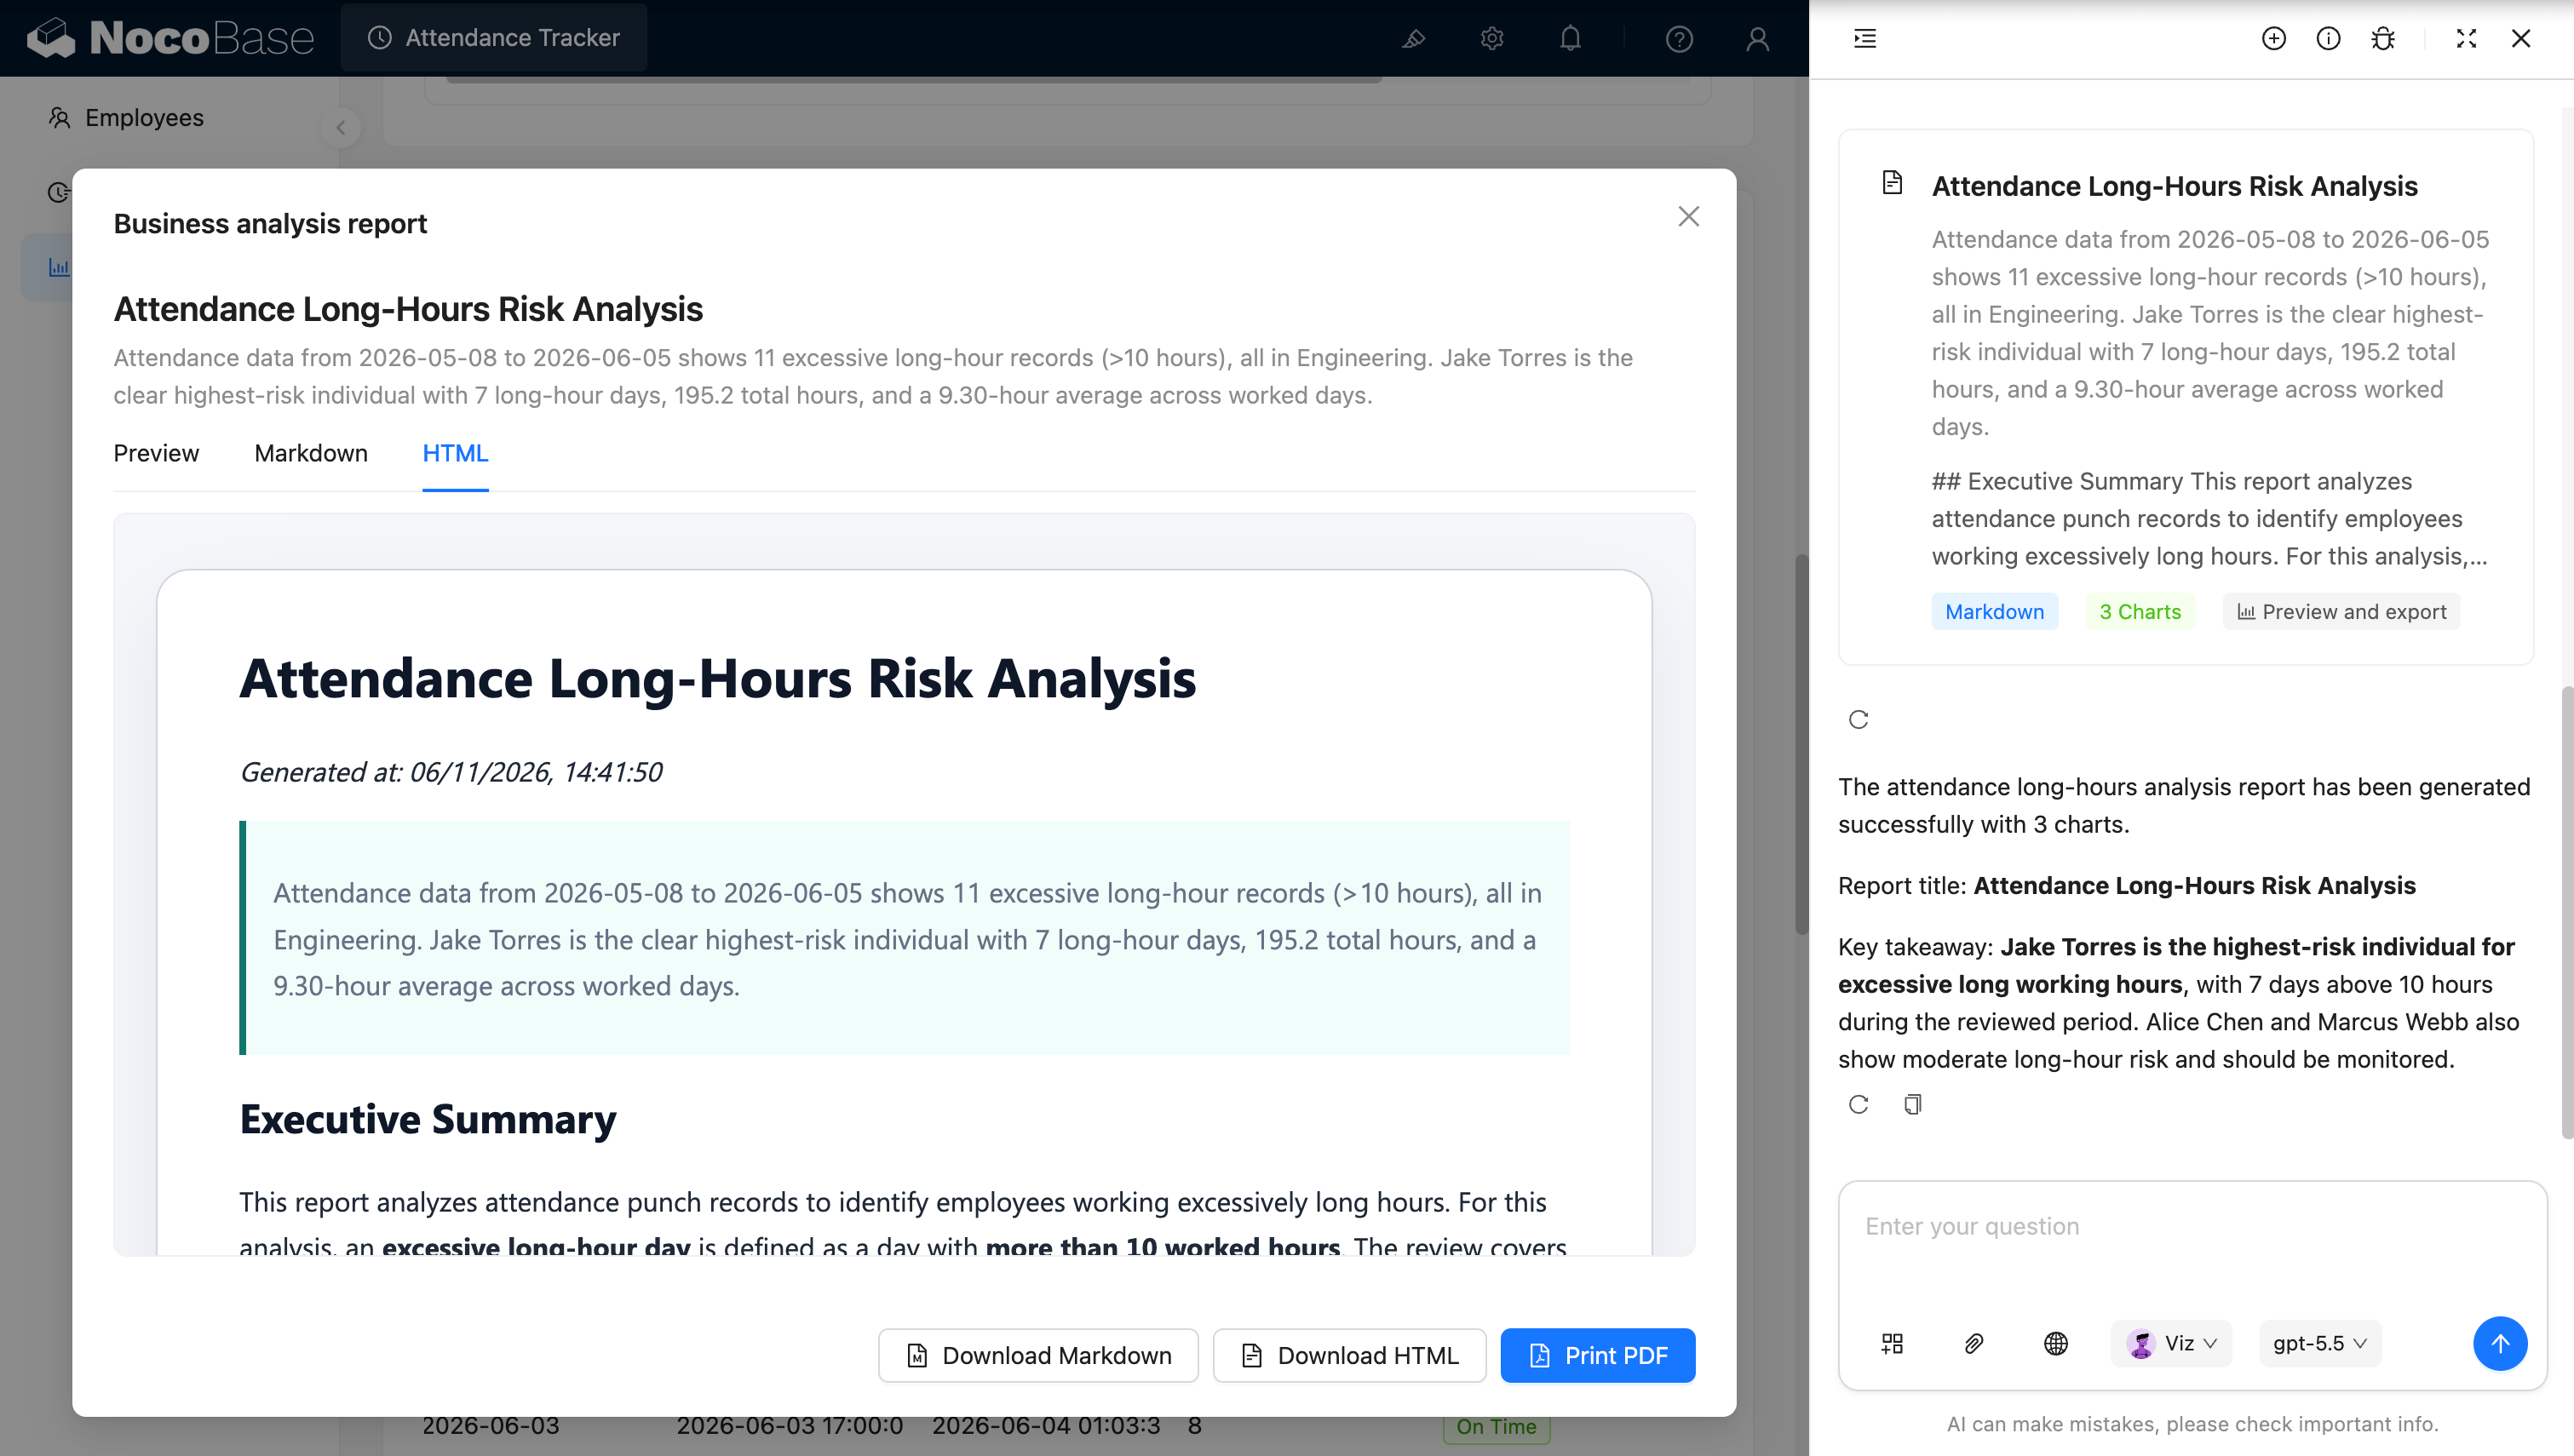
AI agent tạo báo cáo phân tích và đề xuất:
Hệ thống khảo sát mức độ hài lòng nhân viên giải quyết vấn đề gì?
Khó khăn của khảo sát mức độ hài lòng nhân viên không chỉ là thu thập bảng câu hỏi, mà là chuyển đổi lượng lớn điểm đánh giá và phản hồi văn bản thành những thông tin tổ chức rõ ràng, có thể so sánh và theo dõi liên tục.
Nếu nhóm chỉ dùng biểu mẫu thông thường để thu thập phản hồi, bộ phận nhân sự thường phải tính thủ công eNPS, điểm trung bình, tỷ lệ phản hồi và mức gắn kết, rồi tổng hợp riêng kết quả theo phòng ban và theo chiều đánh giá. Khi phản hồi câu hỏi mở tăng lên, việc nhanh chóng đánh giá tổng thể cảm xúc nhân viên và các vấn đề thường gặp cũng trở nên khó khăn hơn.
Với hệ thống này, bạn có thể xem tập trung các chỉ số cốt lõi như eNPS, mức độ hài lòng tổng thể, tỷ lệ phản hồi và mức gắn kết, đồng thời phân tích các chiều như cân bằng công việc-cuộc sống, quản lý và lãnh đạo, phát triển và thăng tiến, lương thưởng và phúc lợi, cộng tác nhóm, văn hóa doanh nghiệp và nhận diện vai trò.
Hệ thống cũng có thể hiển thị xu hướng hài lòng, giúp các nhóm so sánh kết quả theo quý hoặc theo đợt khảo sát. Bản đồ nhiệt theo phòng ban và chiều đánh giá trực quan cho thấy nhóm hoặc chiều nào đang hoạt động kém — giúp người quản lý nhanh chóng xác định khu vực cần chú ý.
Đối với các câu trả lời câu hỏi mở, hệ thống có thể phân loại cảm xúc thành tích cực, hỗn hợp hoặc tiêu cực, và hiển thị phản hồi đại diện của nhân viên kèm theo vai trò, phòng ban, chiều liên quan và điểm đánh giá — kết nối dữ liệu định lượng với tiếng nói thực sự của nhân viên.
Tính năng cốt lõi
Chỉ số hài lòng nhân viên cốt lõi
- Phân tích eNPS: Tự động tính điểm Net Promoter Score của nhân viên và hiển thị tỷ lệ người ủng hộ, trung lập và phản đối.
- Mức độ hài lòng tổng thể: Tổng hợp điểm trung bình trên tất cả các chiều khảo sát để nắm nhanh trải nghiệm nhân viên tổng thể.
- Tỷ lệ phản hồi và mức gắn kết: Hiển thị số người thực tế đã trả lời, tỷ lệ phản hồi khảo sát và chỉ số gắn kết nhân viên để đánh giá mức độ đại diện của kết quả khảo sát.
Phân tích theo chiều hài lòng
- Chấm điểm đa chiều: Phân tích các chiều như cân bằng công việc-cuộc sống, quản lý và lãnh đạo, phát triển và thăng tiến, lương thưởng và phúc lợi, cộng tác nhóm, văn hóa doanh nghiệp và nhận diện vai trò.
- Xác định vấn đề điểm thấp: Dùng điểm theo chiều để nhanh chóng định vị các lĩnh vực nhân viên không hài lòng.
- Khám phá thế mạnh: Xác định các lĩnh vực hoạt động tốt như cộng tác nhóm và văn hóa doanh nghiệp làm tham chiếu cho cải thiện quản lý.
So sánh xu hướng khảo sát
- Xu hướng liên chu kỳ: So sánh thay đổi trong mức độ hài lòng tổng thể, eNPS và mức gắn kết theo quý hoặc theo đợt khảo sát.
- Theo dõi hiệu quả cải thiện: Quan sát liệu các chỉ số có tiếp tục cải thiện sau khi triển khai các biện pháp quản lý hay không.
- Tích lũy dữ liệu dài hạn: Lưu giữ kết quả khảo sát lịch sử để xây dựng hồ sơ trải nghiệm nhân viên có thể so sánh liên tục.
Bản đồ nhiệt theo phòng ban và chiều đánh giá
- So sánh liên phòng ban: So sánh hiệu suất hài lòng trên các phòng ban như Engineering, Sales, Marketing, HR và Finance.
- Phân tích chéo theo chiều: Dùng bản đồ nhiệt để hiển thị điểm trung bình của mỗi phòng ban trên mọi chiều khảo sát.
- Xác định phòng ban trọng điểm: Nhanh chóng phát hiện các vấn đề nổi bật ở các phòng ban cụ thể về lương thưởng, quản lý, phát triển hoặc khối lượng công việc.
Phân bổ điểm theo câu hỏi
- Phân tích từng câu: Hiển thị phân bổ câu trả lời từ 1 đến 5 và điểm trung bình của mỗi câu hỏi.
- Phát hiện ý kiến phân cực: Xác định liệu phản hồi của nhân viên có tương đối nhất quán hay bị phân chia rõ ràng giữa điểm cao và thấp.
- Theo dõi câu hỏi chính: Tập trung vào các câu hỏi về giao tiếp quản lý, khối lượng công việc, phát triển nghề nghiệp và mức sẵn lòng giới thiệu công ty.
Phân tích phản hồi câu hỏi mở
- Phân loại cảm xúc: Phân loại phản hồi câu hỏi mở thành tích cực, hỗn hợp hoặc tiêu cực và báo cáo tỷ lệ từng loại.
- Nhóm chủ đề phản hồi: Tổ chức ý kiến nhân viên theo các chiều như cộng tác nhóm, quản lý và lãnh đạo, phát triển và thăng tiến, và văn hóa doanh nghiệp.
- Hiển thị phản hồi đại diện: Duyệt thẻ phản hồi hiển thị nội dung bình luận, vai trò nhân viên, phòng ban, nhãn cảm xúc và điểm đánh giá.
AI phân tích và tạo báo cáo
- AI nhận dạng cảm xúc: Tự động phân tích cảm xúc của câu trả lời câu hỏi mở — giảm công phân loại thủ công từng câu.
- AI trích xuất vấn đề chính: Tóm tắt các chủ đề thường gặp, điểm đau chính và thế mạnh từ lượng lớn phản hồi nhân viên.
- AI tạo đề xuất cải thiện: Kết hợp eNPS, điểm theo chiều và khác biệt phòng ban để đưa ra phân tích hài lòng nhân viên và đề xuất hành động tiếp theo.
Tại sao nên xây dựng hệ thống khảo sát mức độ hài lòng nhân viên bằng AI và NocoBase?
Mục đích của khảo sát mức độ hài lòng nhân viên là giúp các nhóm liên tục so sánh kết quả, phát hiện vấn đề và lưu giữ dữ liệu lịch sử trên các phòng ban và đợt khảo sát.
Nếu bạn chỉ dùng vibe coding thông thường để tạo trang khảo sát từ đầu, thường chỉ có được phần thu thập biểu mẫu. Việc tính toán eNPS, chấm điểm theo chiều, so sánh phòng ban, phân tích xu hướng, phân loại cảm xúc câu hỏi mở và hiển thị phản hồi vẫn cần phát triển thêm.
NocoBase có thể kết nối khảo sát, câu hỏi, câu trả lời, phòng ban, vai trò và đợt khảo sát, đồng thời trình bày phân tích qua biểu đồ, bản đồ nhiệt và thẻ phản hồi. Các nhóm cũng có thể điều chỉnh chiều đánh giá, phương pháp chấm điểm và trang để phù hợp với cơ cấu tổ chức và khung khảo sát của riêng mình.
AI có thể xử lý sâu hơn các câu trả lời câu hỏi mở. Bạn có thể để AI tự động xác định phản hồi là tích cực, hỗn hợp hay tiêu cực, và phân loại câu trả lời vào các chiều như quản lý, phát triển, cộng tác và văn hóa — giảm công sức nhân sự phải sắp xếp thủ công lượng lớn văn bản.
Một hệ thống khảo sát hài lòng được xây dựng theo cách này không phải là bảng câu hỏi một lần, mà là một hệ thống phản hồi tổ chức liên tục tích lũy dữ liệu, so sánh xu hướng, phân tích khác biệt nhóm và theo dõi cải thiện theo thời gian.
FAQ
- Có thể tự động tính điểm Net Promoter Score (eNPS) của nhân viên không?
Có. Dựa trên điểm đánh giá của nhân viên cho câu “liệu bạn có giới thiệu công ty không,” hệ thống tự động phân biệt người ủng hộ, trung lập và phản đối, đồng thời tính điểm eNPS cùng tỷ lệ của mỗi nhóm.
Người quản lý không chỉ thấy điểm cuối cùng, mà còn biết liệu sự thay đổi trong eNPS đến từ việc giảm người ủng hộ hay tăng người phản đối.
- Ngoài eNPS, còn có thể xem những chỉ số cốt lõi nào khác?
Bạn cũng có thể xem mức độ hài lòng tổng thể, tỷ lệ phản hồi khảo sát, mức gắn kết nhân viên và số người thực tế đã trả lời.
Ví dụ, nếu điểm hài lòng cao nhưng tỷ lệ phản hồi quá thấp, kết quả có thể không đại diện cho toàn bộ nhân viên; chỉ số gắn kết giúp nhân sự đánh giá có bao nhiêu nhân viên đang tích cực tham gia.
- Có thể phân tích kết quả theo các chiều hài lòng khác nhau không?
Có. Hệ thống có thể báo cáo riêng các chiều như cân bằng công việc-cuộc sống, quản lý và lãnh đạo, phát triển và thăng tiến, lương thưởng và phúc lợi, cộng tác nhóm, văn hóa doanh nghiệp và nhận diện vai trò.
Điều này có giá trị hơn một điểm tổng thể duy nhất, vì nhóm có thể biết chính xác vấn đề chủ yếu đến từ quản lý, lương thưởng hay phát triển nghề nghiệp.
- Có thể so sánh sự khác biệt hài lòng giữa các phòng ban không?
Có. Bản đồ nhiệt theo phòng ban và chiều đánh giá hiển thị điểm trung bình của mỗi phòng ban trên mọi chiều.
Ví dụ, một phòng ban có thể hoạt động tốt trong cộng tác nhóm nhưng điểm thấp đáng kể về cân bằng công việc-cuộc sống hoặc lương thưởng và phúc lợi. Nhân sự sau đó có thể thiết kế kế hoạch cải thiện có mục tiêu hơn thay vì áp dụng cùng một biện pháp cho toàn công ty.
- AI có thể phân tích phản hồi câu hỏi mở của nhân viên không?
Có. AI có thể xác định câu trả lời văn bản là phản hồi tích cực, hỗn hợp hoặc tiêu cực, và tiếp tục phân loại chúng vào các chiều như quản lý, phát triển, cộng tác, văn hóa và lương thưởng.
Nó cũng có thể trích xuất các vấn đề lặp lại và chủ đề tích cực từ lượng lớn câu trả lời — giảm công đọc thủ công và phân loại của nhân sự.
- AI có thể trực tiếp tạo kết luận khảo sát và đề xuất hành động tiếp theo không?
Có. AI có thể kết hợp điểm đánh giá, eNPS, khác biệt phòng ban và phản hồi câu hỏi mở để tạo báo cáo phân tích khảo sát nhân viên và kế hoạch tiếp theo.
Ví dụ, báo cáo trong ảnh chụp màn hình xác định các vấn đề ưu tiên như cân bằng công việc-cuộc sống, lương thưởng, khả năng phản hồi của quản lý và phát triển nghề nghiệp, chỉ ra phòng ban nào cần chú ý thêm và đề xuất các hành động cải thiện.
- Phản hồi của nhân viên có thể giữ ẩn danh không?
Có. Bạn có thể cấu hình chế độ ẩn danh hoặc có tên dựa trên quy tắc khảo sát của bạn.
Đối với khảo sát ẩn danh, bạn có thể ngăn người quản lý thông thường xem danh tính cá nhân và chỉ hiển thị tổng hợp theo phòng ban hoặc chiều đánh giá. Đối với khảo sát có tên, phân quyền quyết định nhân sự, trưởng phòng ban hay quản trị viên có thể xem thông tin gì.
Quy tắc ẩn danh nên được giải thích rõ ràng trước khi nhân viên gửi phản hồi để tránh lo ngại về cách dữ liệu sẽ được sử dụng.
- Trưởng phòng ban có thể chỉ xem kết quả của phòng ban mình không?
Có. NocoBase hỗ trợ phân quyền theo vai trò và phạm vi dữ liệu.
Ví dụ, trưởng phòng ban chỉ có thể xem điểm tổng hợp và xu hướng phản hồi của phòng ban mình, nhân sự có thể xem phân tích liên phòng ban, và quản trị viên xử lý cấu hình khảo sát. Đối với các phòng ban có mẫu rất nhỏ, bạn cũng có thể hạn chế xem chi tiết để giảm rủi ro xác định cá nhân từ phản hồi của họ.
- Có thể theo dõi ai đã xem hoặc sửa dữ liệu khảo sát không?
Có. Bạn có thể bật lịch sử thao tác và nhật ký kiểm toán theo yêu cầu để ghi lại các hành động quan trọng như cấu hình khảo sát, sửa đổi kết quả, thay đổi phân quyền và truy cập báo cáo.
Khảo sát nhân viên liên quan đến thông tin nội bộ nhạy cảm; lưu giữ hồ sơ thao tác giúp công ty kiểm soát quyền truy cập dữ liệu và truy vết sự cố khi xảy ra thay đổi nhầm hoặc tranh chấp dữ liệu.
- Claude Code, Codex, Cursor hoặc OpenCode có thể giúp xây dựng hệ thống này không?
Có. Các AI coding agent như Claude Code, Codex, Cursor và OpenCode có thể kết nối với NocoBase và tạo khảo sát, câu hỏi, câu trả lời, chiều hài lòng và trang phân tích từ các prompt.
Sau đó, nhân sự vẫn có thể điều chỉnh câu hỏi khảo sát, phương pháp thống kê, phân quyền và biểu đồ thông qua giao diện no-code của NocoBase — mà không cần phát triển lại mỗi khi khảo sát thay đổi.
- Điều này khác gì so với bảng câu hỏi trực tuyến thông thường hoặc trang khảo sát được tạo bằng vibe coding?
Bảng câu hỏi trực tuyến thông thường phù hợp hơn với thu thập dữ liệu một lần, và vibe coding có thể nhanh chóng tạo biểu mẫu khảo sát, nhưng phân quyền, dữ liệu lịch sử, xu hướng liên chu kỳ, so sánh phòng ban, phân tích câu hỏi mở và kiểm toán truy cập thường vẫn cần được xử lý riêng.
NocoBase giữ khảo sát, câu trả lời, phòng ban, vai trò và chu kỳ lịch sử trong một hệ thống duy nhất. AI xử lý phân tích và đề xuất, trong khi NocoBase đảm bảo quan hệ dữ liệu, kiểm soát truy cập và bảo trì lâu dài.
- Hệ thống này có phù hợp để theo dõi mức độ hài lòng nhân viên dài hạn không?
Có. Hệ thống có thể tiếp tục lưu trữ kết quả khảo sát theo quý hoặc năm và so sánh thay đổi trong eNPS, mức độ hài lòng, mức gắn kết, khác biệt phòng ban và các chủ đề câu hỏi mở.
Doanh nghiệp cũng có thể bật SSO, quản lý phân quyền, nhật ký kiểm toán, quy trình làm việc, thông báo và tiện ích mở rộng plugin theo nhu cầu. So với các công cụ khảo sát một lần, nó phù hợp hơn để xây dựng một hệ thống phản hồi nhân viên dài hạn, có thể so sánh với quản trị dữ liệu đúng đắn.