AI エージェントで同じシステムを構築する
用 NocoBase 搭建一个应用 —— 数据质量管理系统:质量总览看板、规则状态、异常列表、数据新鲜度、质量趋势和 AI 数据质量分析报告。布局和标志性视觉参照这个原型:https://static-docs.nocobase.com/solution/templates/31-data-quality.html
prompt にあるプロトタイプのリンク(HTML)は、私たちが事前に用意したデザインで、機能のデモを目的としたものです。NocoBase は「一言でシステム全体を生成する」ことを推奨していません。これを使って構築する際は、NocoBase Skill の「プロトタイプ再現」(nocobase-prototype-repro)と組み合わせると、より良い結果が得られます。
始める前に、AI Agent クイックスタート に従って NocoBase をインストールし、エージェントを接続してください。AI の生成結果には個体差があります。モデルの性能とシステムの複雑さによっては、微調整や複数回のやり取りが必要になる場合があります。
Introduction
Use AI Agents and NocoBase to quickly create a data quality monitoring system that tracks data completeness, accuracy, and timeliness across your data platform.
The system shows the overall quality score, rule pass rate, open issues, data freshness delays, and 14-day quality trends, helping teams quickly understand whether their data platform is healthy.
You can copy the prompt directly and let AI Agents such as Claude Code, Codex, Cursor, and OpenCode generate a data quality monitoring system in NocoBase. After that, you can keep adjusting rules, fields, statuses, and pages through NocoBase’s no-code interface.
This system is designed for data teams, data platform teams, business analysis teams, and operations teams. It helps them quickly identify missing values, invalid formats, duplicate records, delayed data, inconsistent definitions, and reconciliation discrepancies.
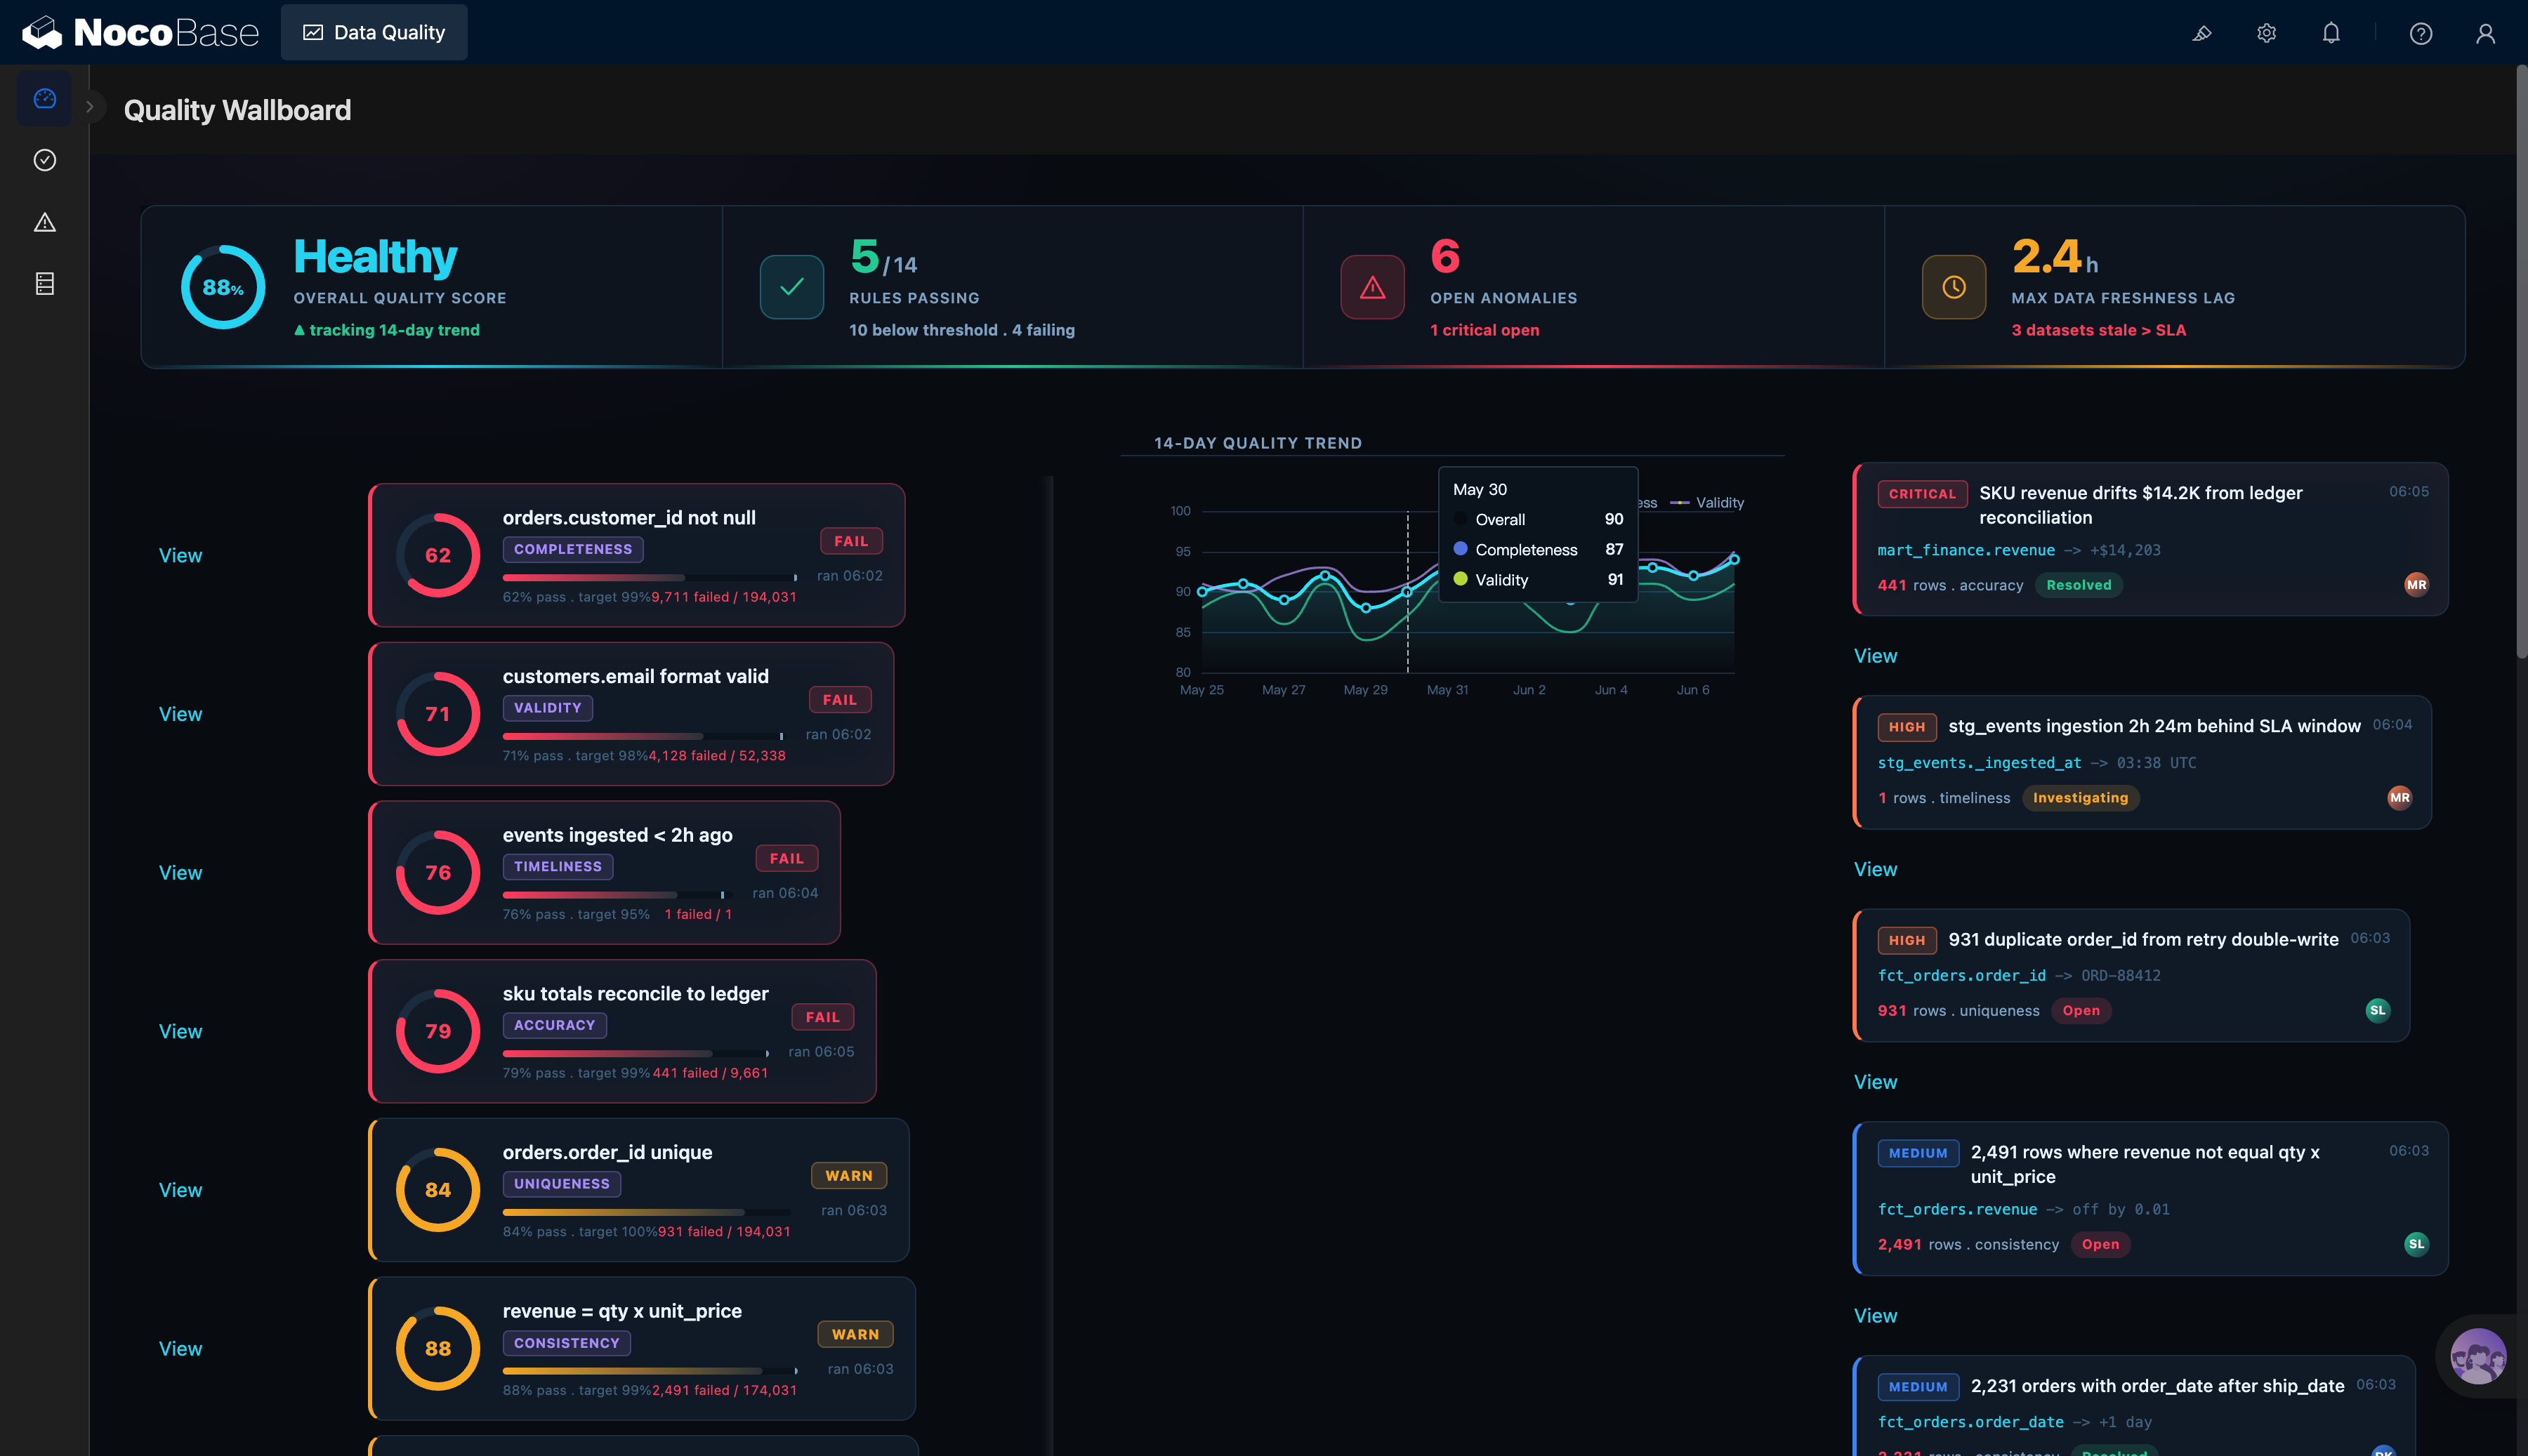
Data quality overview, rule status, and issue list:
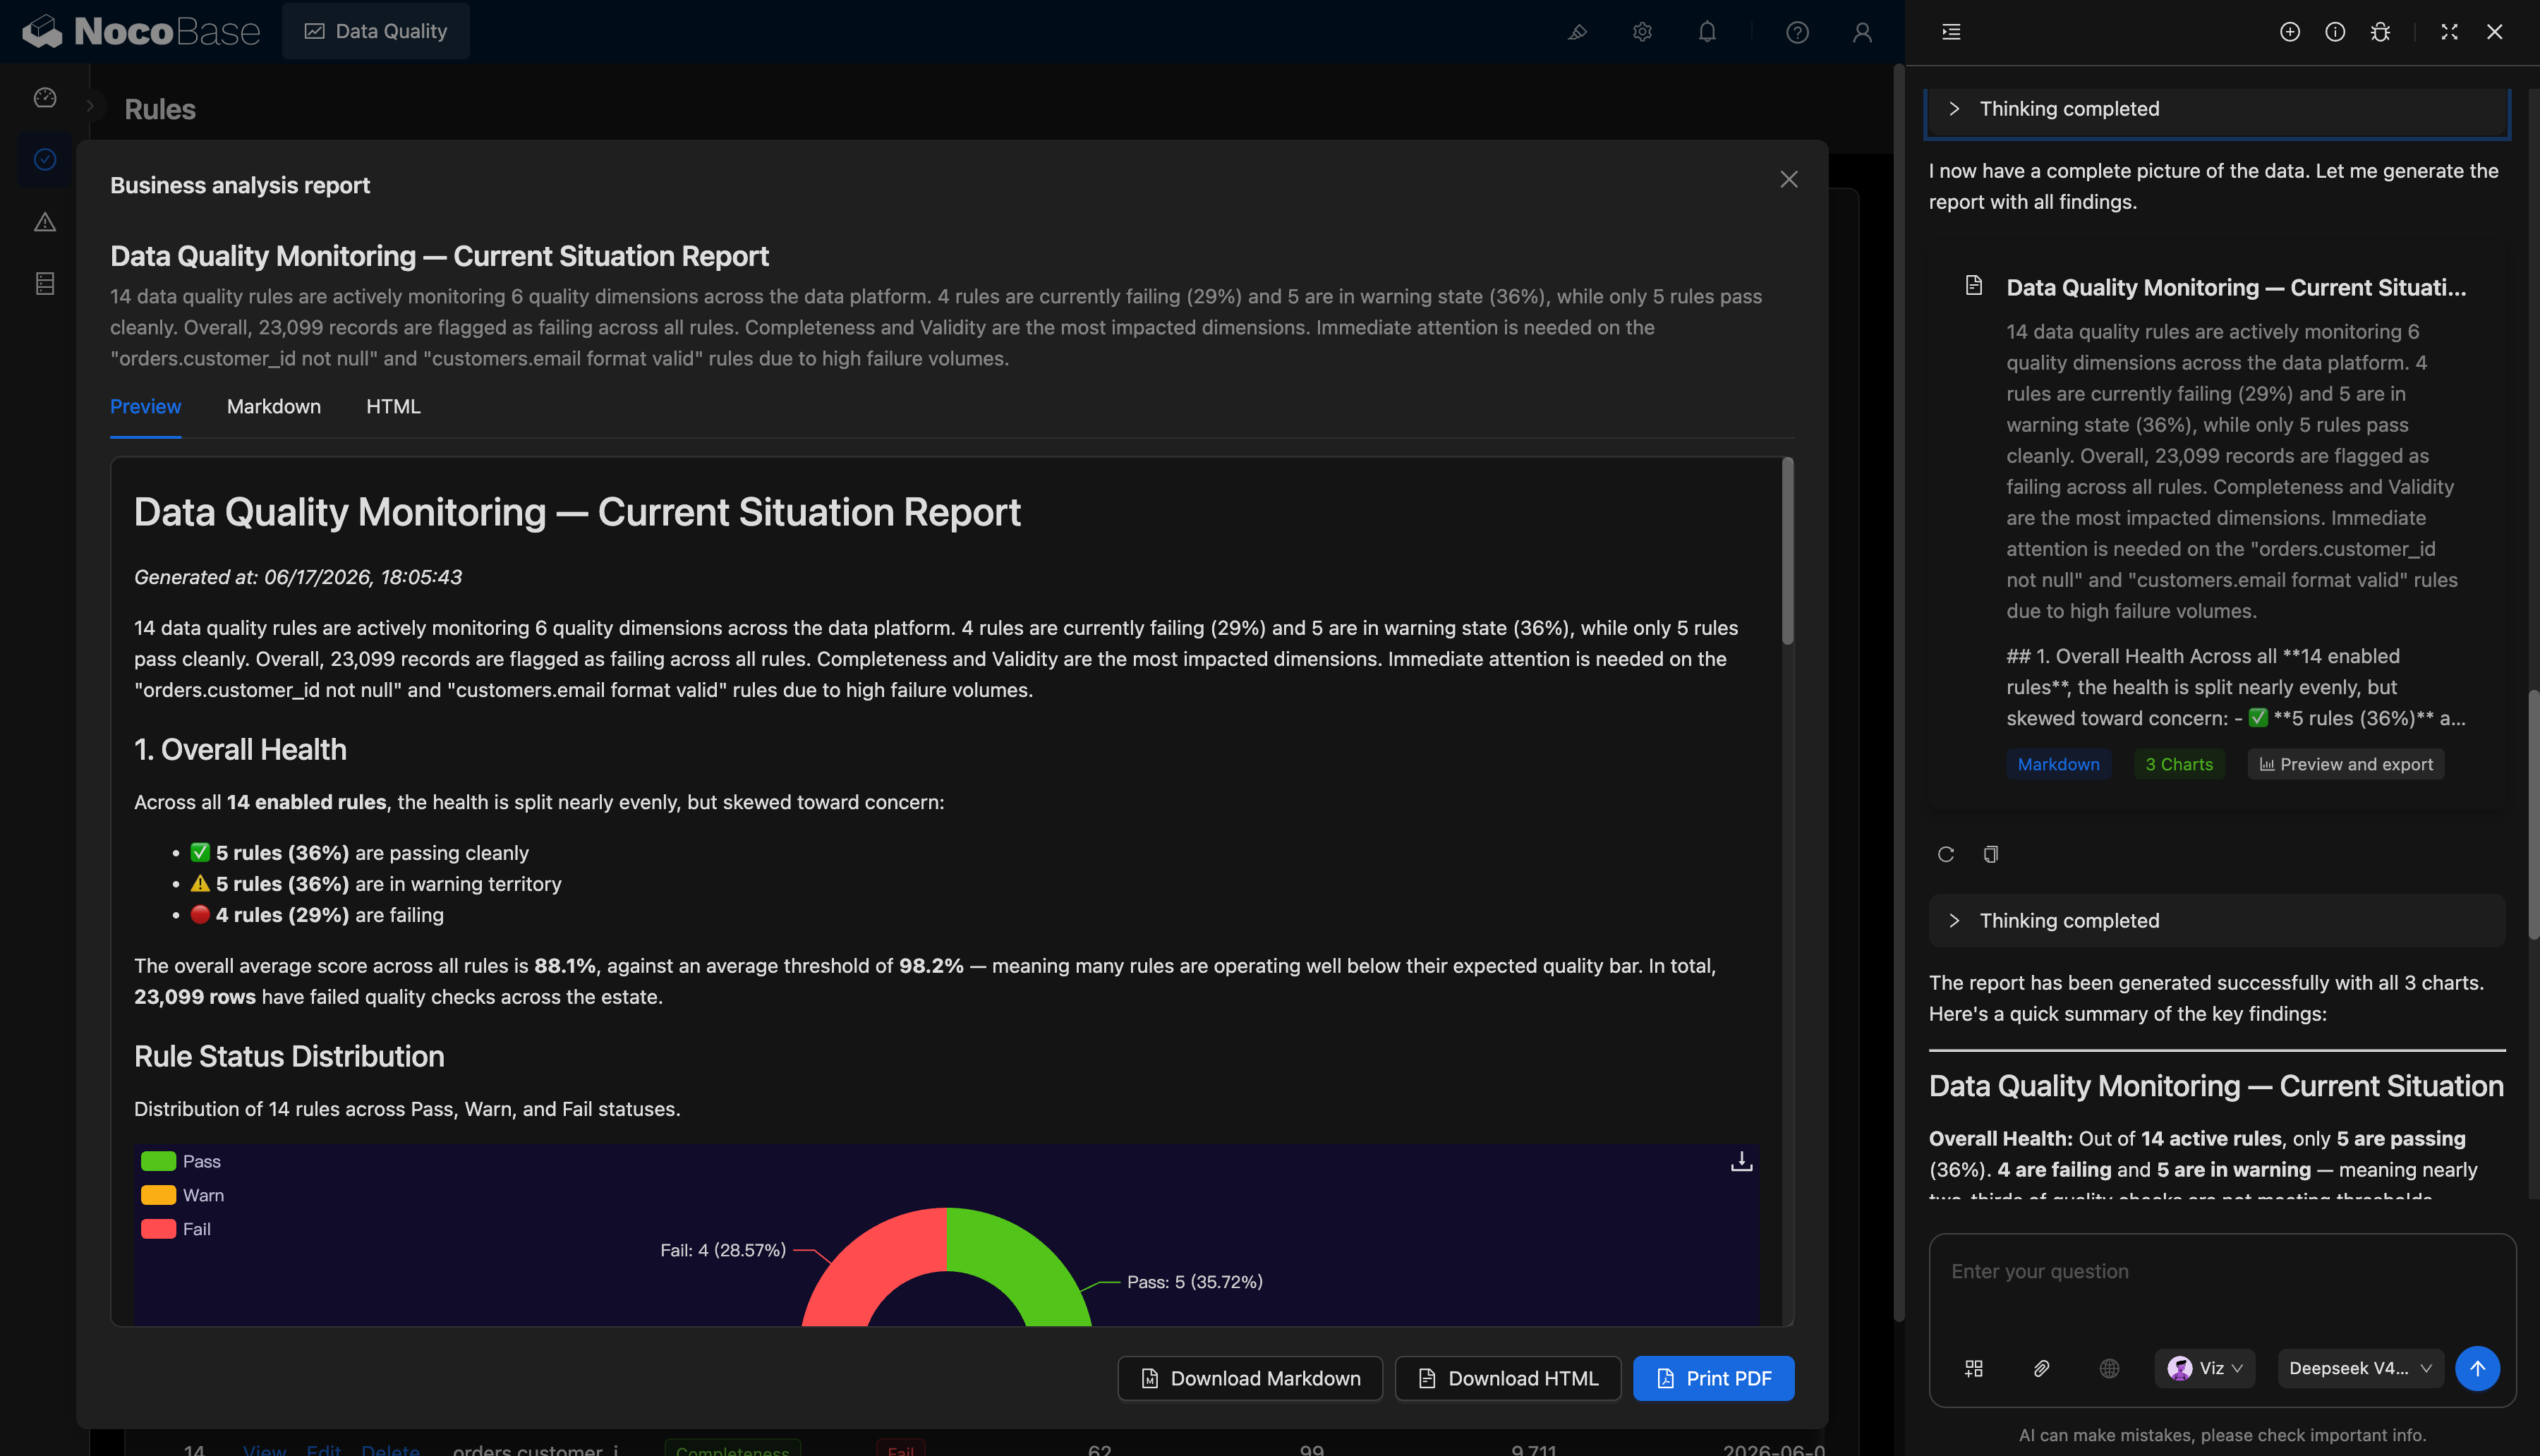
AI-generated data quality analysis report:
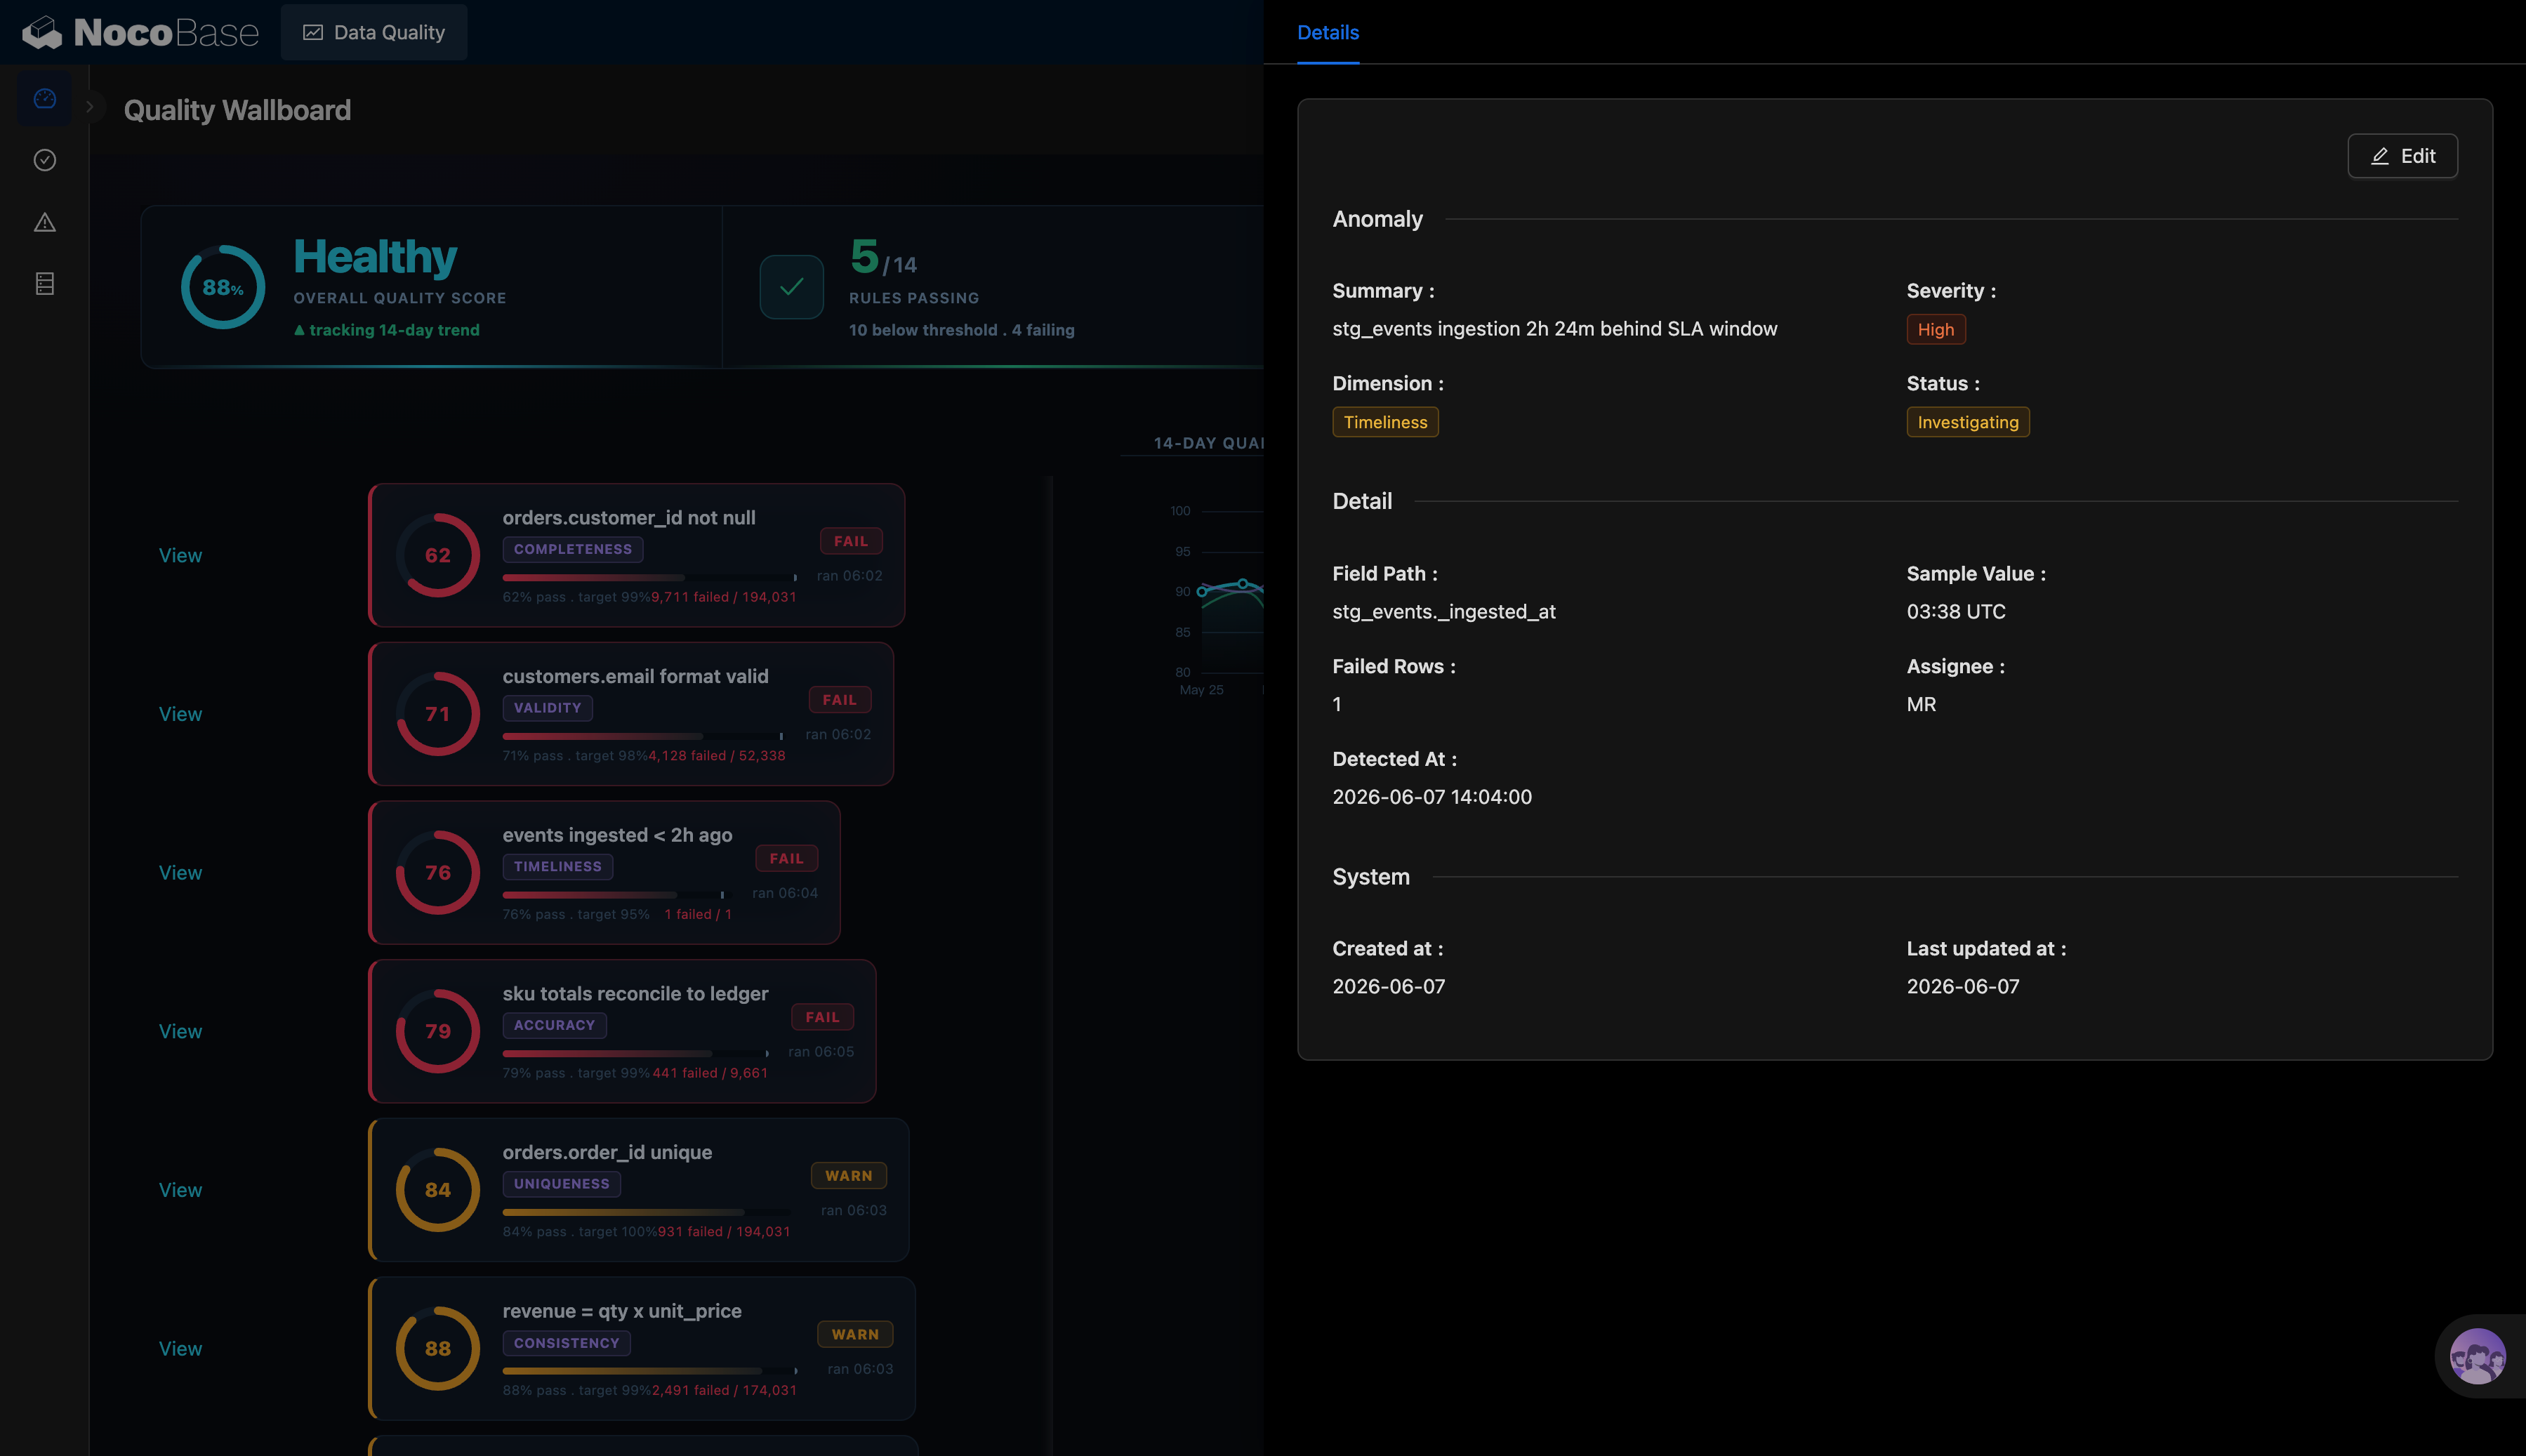
Issue list and issue details:
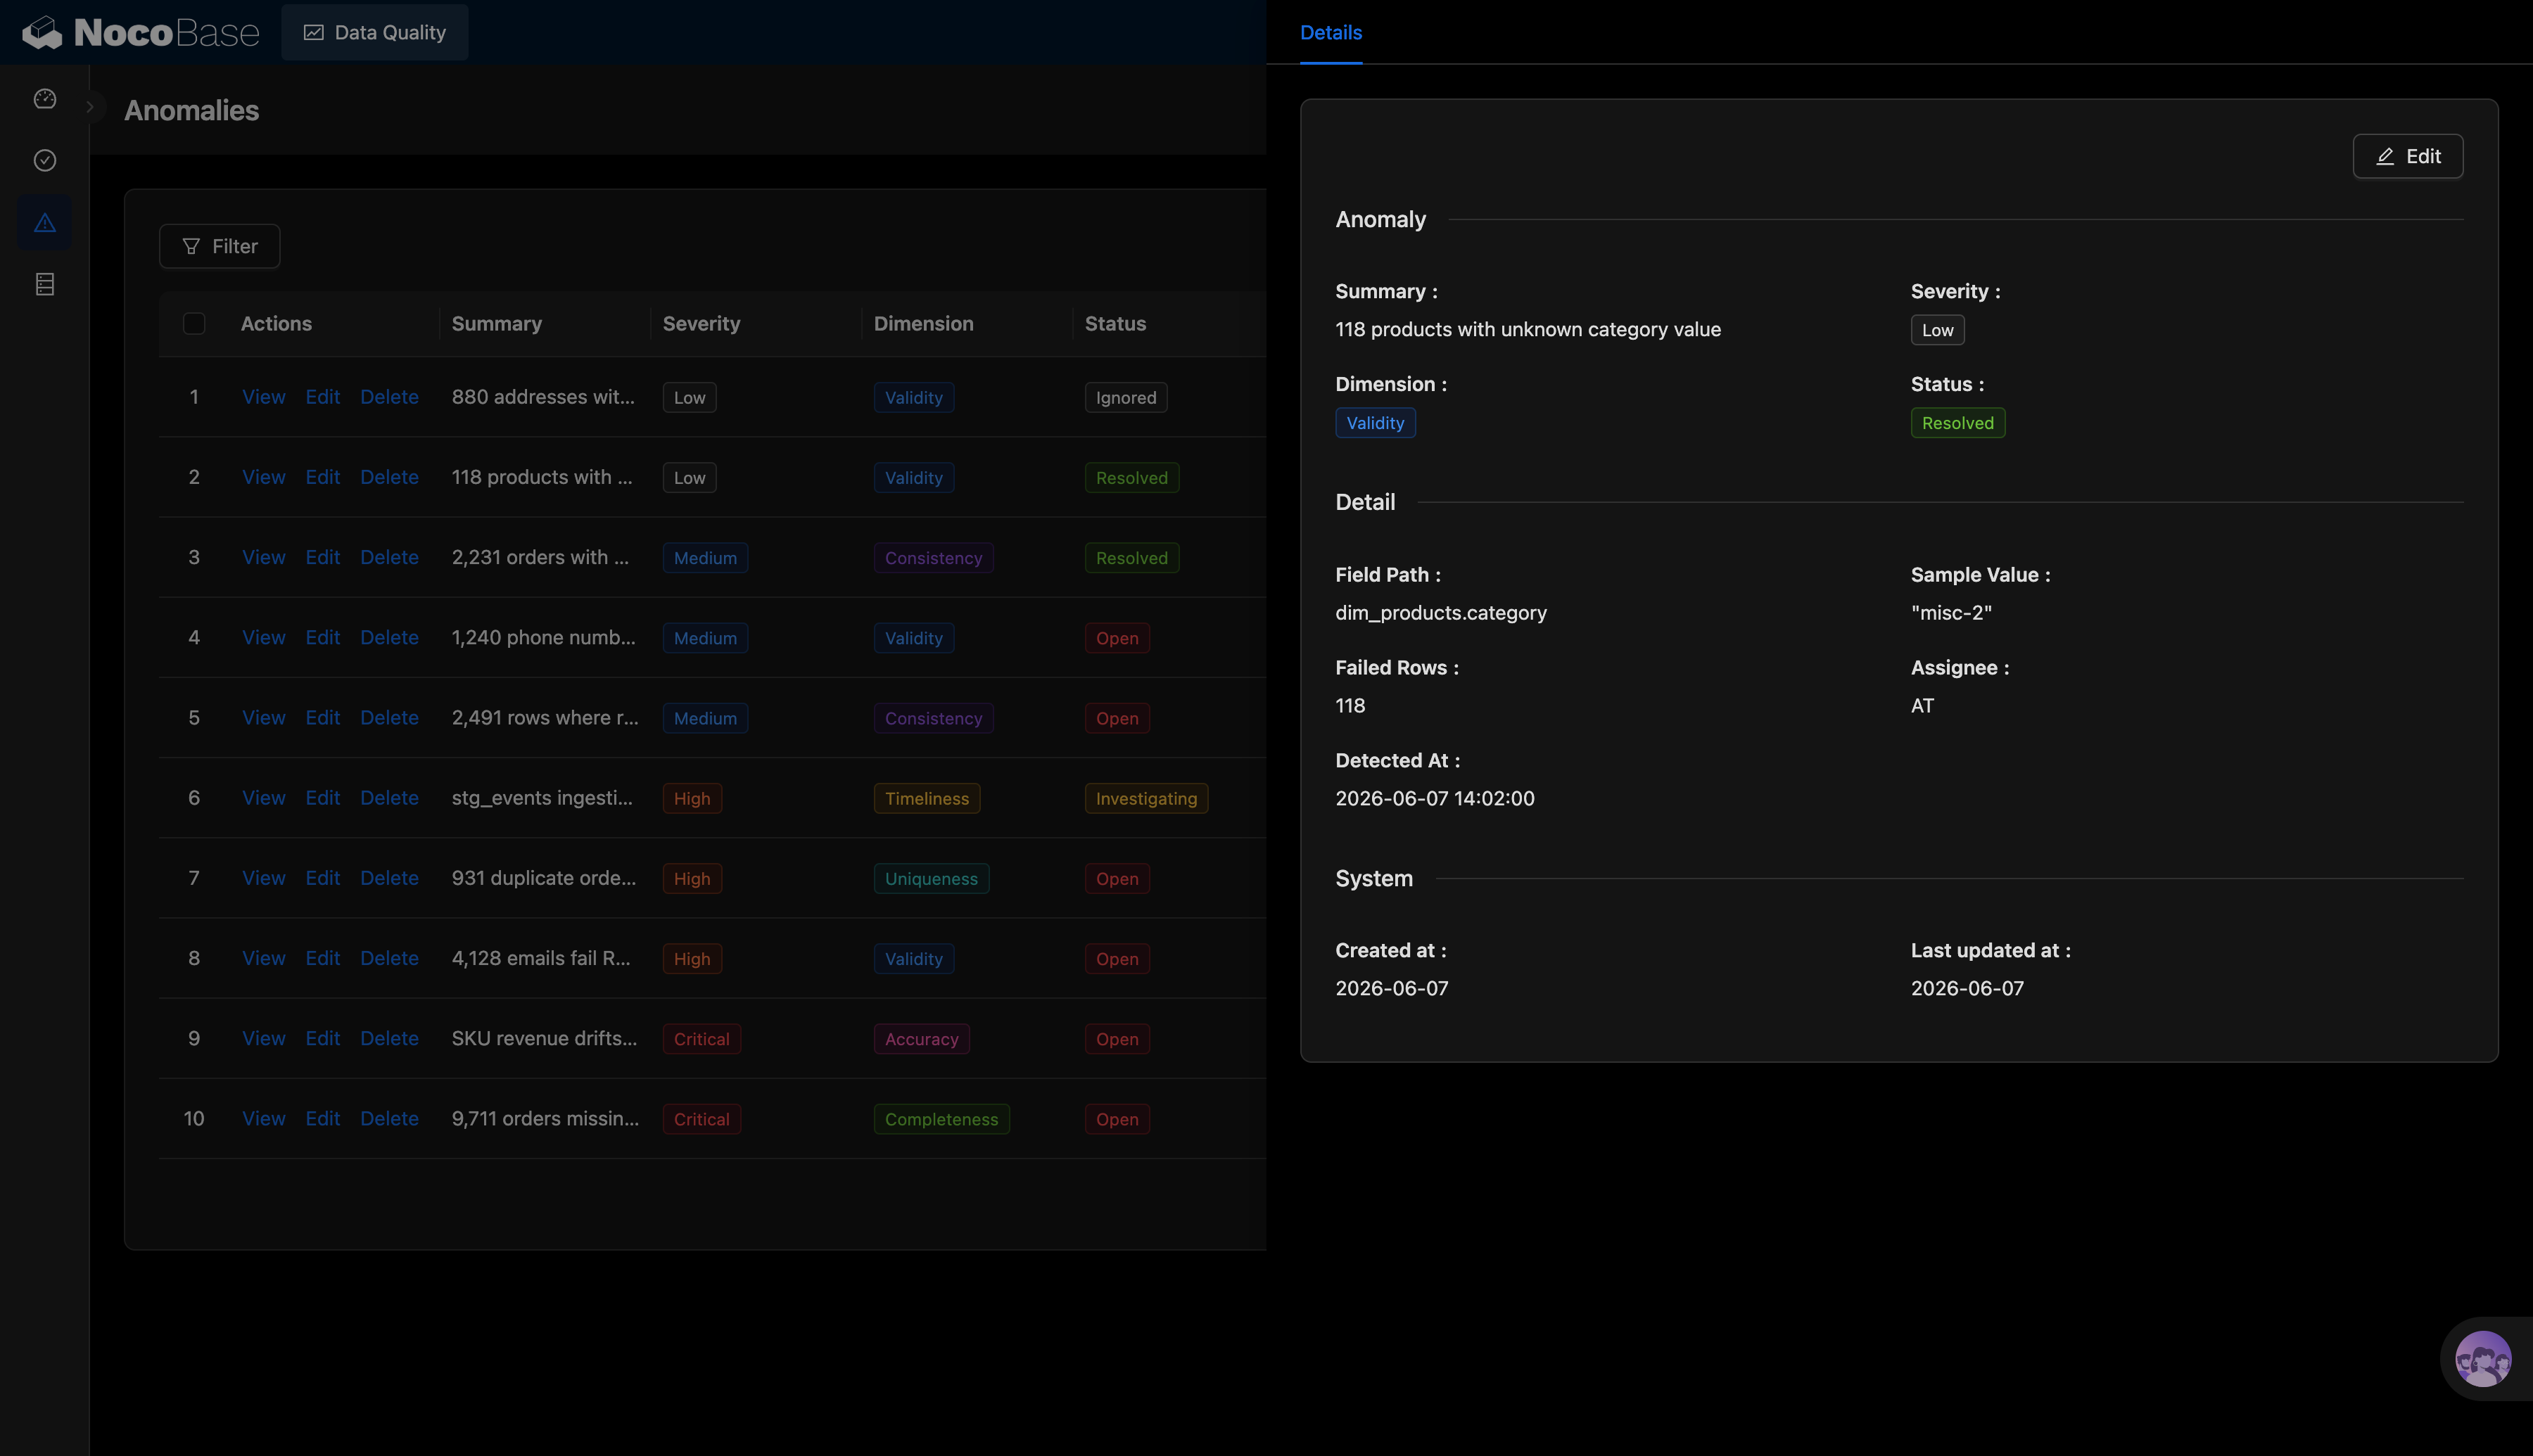
Data freshness issues and handling status:
What problems can a data quality monitoring system solve?
Data quality issues are often scattered across scripts, logs, spreadsheets, and chat history. As a result, teams struggle to see whether rules are passing, whether issues have been handled, whether data is delayed, and which problems have the biggest impact.
With this system, teams can view the overall quality score from a central dashboard. For example, the screenshot shows an overall quality score of 88%, a Healthy status, 5 passed rules out of 14, 6 open issues, and a maximum data freshness delay of 2.4 hours.
Each quality rule can be turned into a trackable monitoring card. Examples include checking that customer IDs are not empty, email formats are valid, events are ingested into the data warehouse within 2 hours, SKU amounts are reconciled, order numbers are unique, and revenue calculations are consistent. Each rule can show its score, status, quality dimension, run time, and failed row count.
The issue list brings different types of problems into one place, including validity, consistency, timeliness, uniqueness, accuracy, and completeness issues. Teams can also prioritize work by severity level, such as low, medium, high, or critical.
AI can generate data quality reports based on rule and issue data. It can automatically summarize the current health status, failed rules, issue distribution, affected record counts, and recommended priorities.
Core features
Data quality overview dashboard
- Overall quality score: Shows the current data quality score, such as 88% Healthy in the screenshot.
- Rule pass status: Shows how many enabled rules have passed, such as 5 out of 14 rules.
- Open issue statistics: Shows the number of currently open issues, such as 6 open issues, and highlights critical ones.
- Data freshness delay: Shows the maximum data delay, such as 2.4 hours, and flags datasets that exceed the service-level agreement (SLA).
- Quality trend analysis: Shows 14-day quality trends and compares changes in metrics such as overall quality, completeness, and validity.
Data quality rule monitoring
- Rule cards: Each rule displays its name, score, status, quality dimension, target threshold, failed row count, and run time.
- Multi-dimensional checks: Supports quality dimensions such as completeness, validity, timeliness, accuracy, uniqueness, and consistency.
- Clear status labels: Supports statuses such as passed, warning, and failed, helping teams quickly find problematic rules.
- Failed data statistics: Shows the failed row count and total data volume, such as 9,711 failed / 194,031.
- Key rule monitoring: Supports common rules such as non-empty customer IDs, valid email formats, event ingestion time, SKU reconciliation, unique order numbers, and consistent revenue calculations.
Issue list and status management
- Centralized issue management: View issue summaries, severity levels, quality dimensions, and handling statuses in one list.
- Severity labels: Supports low, medium, high, and critical levels, helping teams decide what to handle first.
- Status tracking: Supports statuses such as open, investigating, resolved, and ignored.
- Dimension-based classification: Groups issues by validity, consistency, timeliness, uniqueness, accuracy, and completeness.
- Owner management: Each issue can be assigned to an owner, such as AT or MR in the screenshot.
AI data quality analysis report
- AI health summary: Automatically summarizes the number of rules, passed rules, warning rules, failed rules, and the overall quality score.
- AI issue prioritization: Identifies high-priority items based on failed row counts, severity levels, and quality dimensions.
- AI-generated charts: Automatically generates charts for rule status distribution, quality dimension distribution, and trend changes.
- AI analysis report: Generates a current data quality report that explains major risks and recommended actions.
- Report export: Supports preview, Markdown view, and HTML view, and allows reports to be downloaded as Markdown or HTML, or printed as PDF.
Why use AI and NocoBase to build a data quality monitoring system?
Data quality monitoring is more than a dashboard. It also requires rule configuration, issue records, status workflows, owner assignment, trend analysis, and report generation.
If you use a typical Vibe Coding approach to generate pages from scratch, you usually get only a static dashboard. Rule management, issue details, permission control, status tracking, historical records, and report export still require ongoing development.
NocoBase allows you to manage quality rules, issue records, owners, handling statuses, and analysis reports in one system. Data teams can maintain rules, business teams can view issues, and managers can monitor overall data health from dashboards.
Teams can also adjust quality dimensions, rule thresholds, issue severity levels, and handling workflows based on their own business needs. For example, financial data usually focuses more on accuracy and consistency, user data focuses more on validity and completeness, and data pipelines focus more on timeliness.
AI further reduces the cost of analysis. The AI data analyst shown in the screenshot can read rule and issue data, summarize enabled rules, failed rules, warning rules, passed rules, and failed records, and then generate a data quality report with charts.
The result is not just a quality dashboard. It is a long-term business system covering rule monitoring, issue management, status tracking, trend analysis, and AI reporting.
FAQ
1.Can the overall data quality status be viewed in one dashboard?
Yes. The quality dashboard can show the overall quality score, number of passed rules, number of open issues, and maximum data freshness delay in one place.
For example, the screenshot shows an overall quality score of 88%, a Healthy status, 5 passed rules out of 14, 6 open issues, and a maximum data freshness delay of 2.4 hours.
2.Can different types of data quality rules be monitored?
Yes. The system can manage data quality rules by dimensions such as completeness, validity, timeliness, accuracy, uniqueness, and consistency.
For example, it can monitor whether customer IDs are not empty, email formats are valid, events are ingested within 2 hours, SKU amounts are reconciled, order numbers are unique, and revenue calculations are consistent.
3.Can each rule show its failed count and target threshold?
Yes. Each rule can show the current score, target threshold, failed row count, and total data volume.
For example, some rules in the screenshot show 9,711 failed records, while others show 441 failed records. Teams can use this information to decide what to handle first.
4.Can data issue severity and handling status be managed?
Yes. The issue list can show severity levels such as low, medium, high, and critical, as well as statuses such as open, investigating, resolved, and ignored.
For example, a data freshness delay can be marked as high risk and investigating, while an unknown category value can be marked as low risk and resolved.
5.Can AI generate data quality analysis reports?
Yes. AI can read rules, issues, statuses, and trend data to generate a current data quality report.
The report can summarize the number of enabled rules, the proportions of failed, warning, and passed rules, the total number of failed records, the main affected dimensions, and recommended priorities.
6.Can AI-generated reports include charts?
Yes. AI reports can include charts such as rule status distribution, quality dimension distribution, and trend changes.
The report in the screenshot includes a rule status distribution chart and supports preview, Markdown view, and HTML view, making it useful for data team reviews and management reporting.
7.Can AI-generated data quality reports be exported?
Yes. Reports can be downloaded as Markdown or HTML, or printed as PDF.
This makes them suitable for weekly data quality reports, monthly data governance meetings, issue reviews, and cross-team communication.
8.Can Claude Code, Codex, Cursor, and OpenCode help build this system?
Yes. AI Coding Agents such as Claude Code, Codex, Cursor, and OpenCode can connect to NocoBase and generate quality rules, issue lists, quality dashboards, issue detail pages, and AI report pages from prompts.
After the system is generated, teams can continue adjusting fields, rule dimensions, issue statuses, owners, page layouts, and report displays through NocoBase’s no-code interface.
9.How is this different from a data quality dashboard generated by typical Vibe Coding?
Typical Vibe Coding can quickly generate a static dashboard, but enterprise data quality management also requires rule configuration, issue tracking, owner assignment, status workflows, historical records, permission control, and report export.
NocoBase brings rules, issues, owners, statuses, trends, and AI analysis into one system. AI speeds up system creation and report generation, while NocoBase provides the data structure, permission control, and long-term maintainability.
10.Can different teams view only the data quality issues they are responsible for?
Yes. Enterprises can set permissions based on roles, departments, data domains, or owners.
For example, the finance team can view revenue reconciliation and accuracy issues, the data platform team can handle data freshness and ingestion delay issues, and business teams can view issues related to their own datasets.
11.Can the issue handling process be tracked?
Yes. The system can record when an issue was discovered, when it was created, when it was last updated, who owns it, and what its current status is. This helps teams understand when a problem was found, who is responsible for it, and whether it has been resolved.
If stronger traceability is needed, enterprises can also enable operation history and audit logs in NocoBase.
12.Can rules be adjusted based on an enterprise’s own data standards?
Yes. Teams can continue adding or modifying quality dimensions, rule names, target thresholds, failure conditions, issue severity levels, and status workflows.
For example, enterprises can set different rules for order, customer, inventory, finance, or event data, and adjust data freshness thresholds based on service-level agreements.
13.Is this system suitable for production-ready enterprise data quality management?
Yes. Data quality management involves key business metrics, financial definitions, data pipeline stability, and cross-team responsibility tracking. Compared with a one-off dashboard, it requires more stable data structures and stronger workflow capabilities.
NocoBase can enable permission management, workflows, operation history, audit logs, single sign-on, notifications, APIs, and plugin extensions as needed. This makes it suitable for building a maintainable, traceable data quality monitoring system that can run over the long term.