用 AI Agent 搭建同款系統
Build a NocoBase app — Network Monitoring Dashboard System: a NOC dashboard, node status, link utilization, real-time alerts, and an AI health report. Match the layout and signature visuals of this reference prototype: https://static-docs.nocobase.com/solution/templates/36-network-monitoring.html
prompt 裡附的原型連結(HTML)是我們預先做好的設計,僅作能力展示,NocoBase 並不建議「一句話生成整套系統」。使用它進行搭建時,需要搭配 NocoBase Skill 中的「原型解析」(nocobase-prototype-repro),才能得到比較好的效果。
開始前,請先按 AI Agent 快速開始 安裝 NocoBase 並接入你的 AI Agent。AI 生成的結果可能有波動,視模型能力與系統複雜度,可能需要微調或多輪互動。
Introduction
A network monitoring dashboard is suitable for NOC, IT operations, and infrastructure teams that need to monitor routers, switches, firewalls, servers, load balancers, and wireless access points in one place. Teams can see online nodes, degraded nodes, offline nodes, critical alerts, and overall availability for the last 30 days from a single page.
These records can also be managed as a NocoBase-based internal business system, with network devices, uptime status, alerts, incidents, latency, monitoring metrics, and operations dashboards organized through configurable data models, role permissions, views, workflows where needed, and operation history.
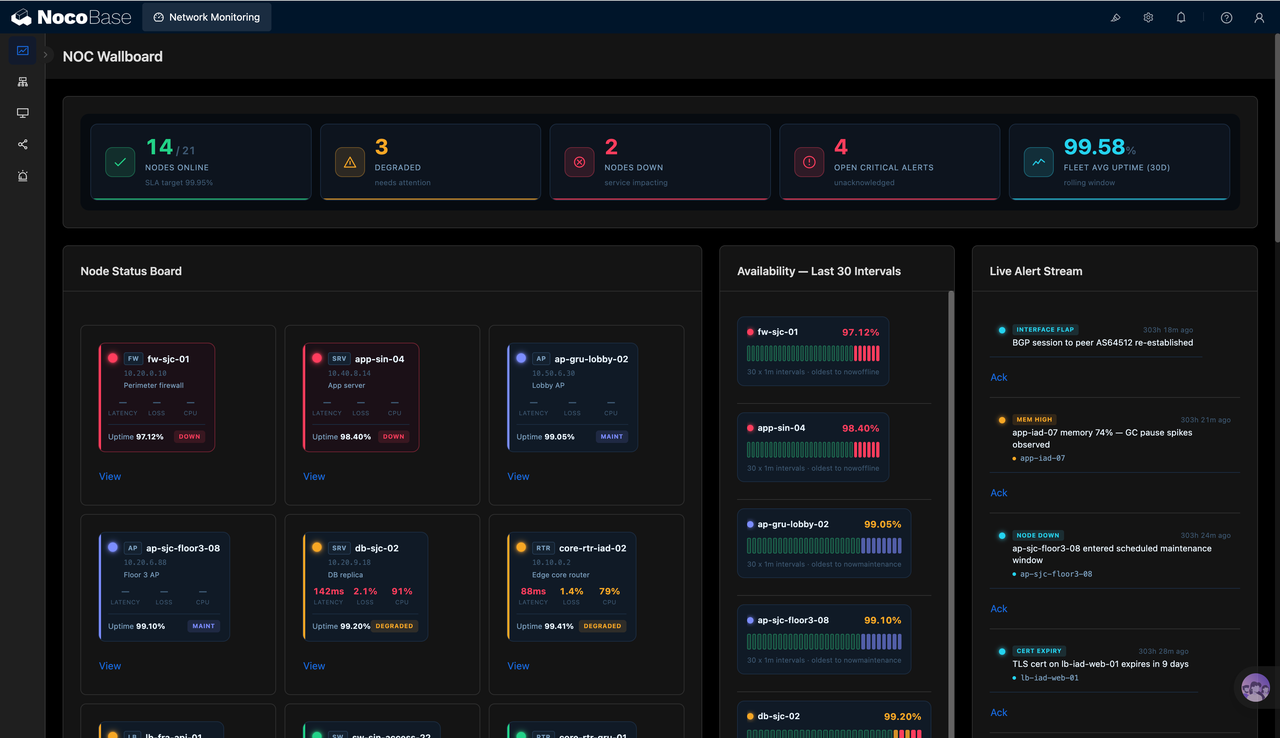
The page centers on a NOC Wallboard, bringing node status cards, recent availability, a real-time alert stream, and key metrics onto the same screen. Operations teams can quickly see which nodes are down, which nodes are degraded or under maintenance, and which alerts need acknowledgment.
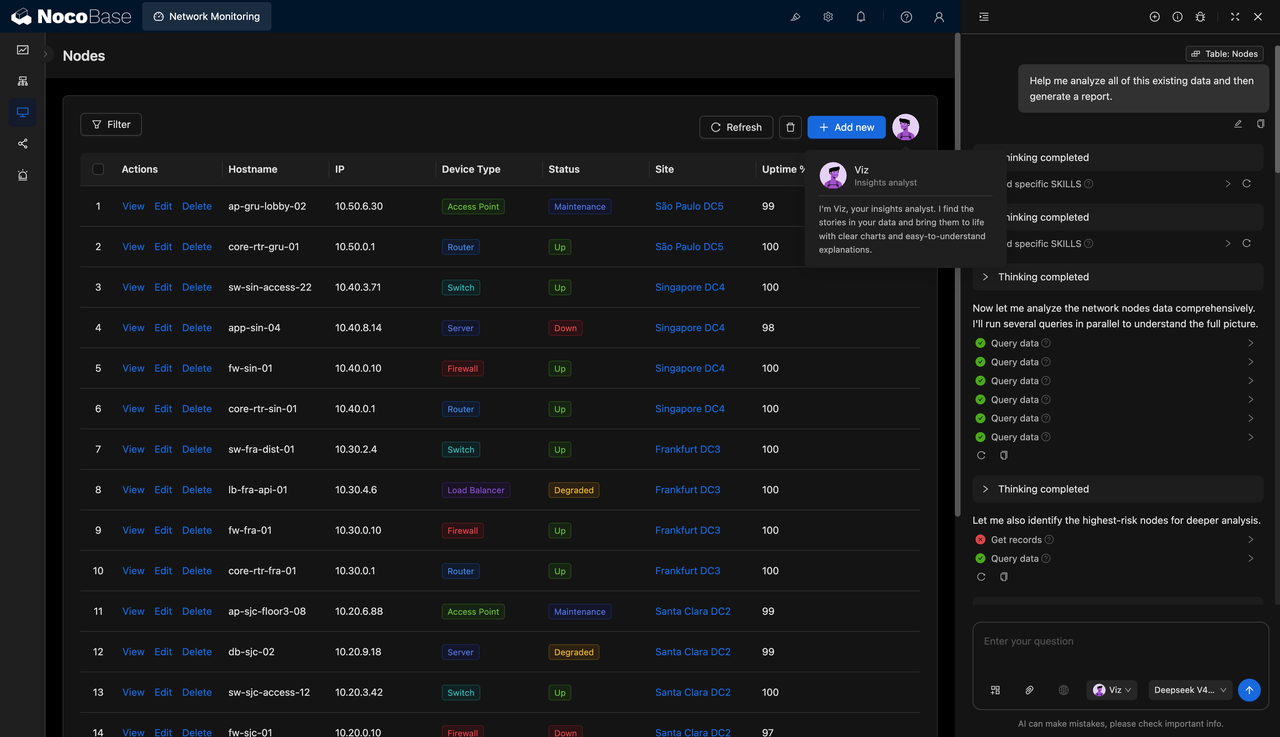
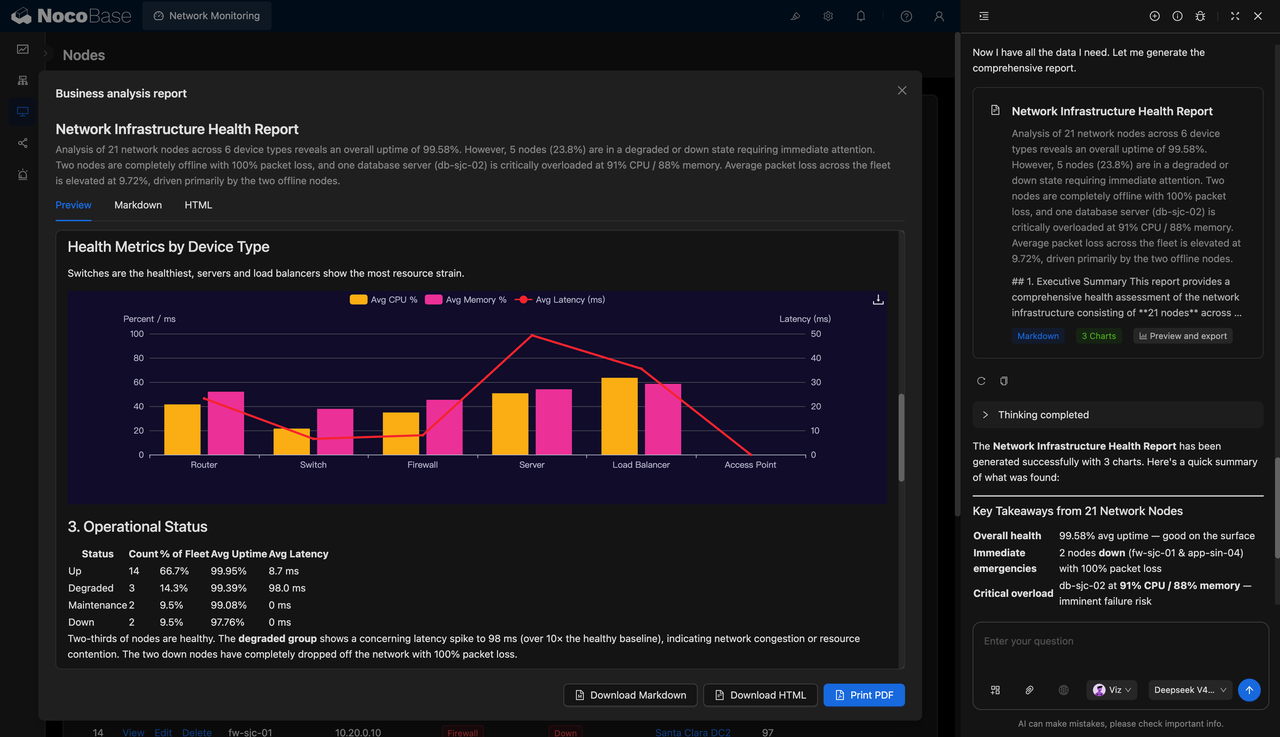
With AI Agent, the system can read node data and generate a network infrastructure health report. It can analyze health metrics across device types, degraded nodes, offline nodes, resource pressure, and risks that need priority attention.
NOC dashboard showing online rate, degraded nodes, outages, and real-time alerts:
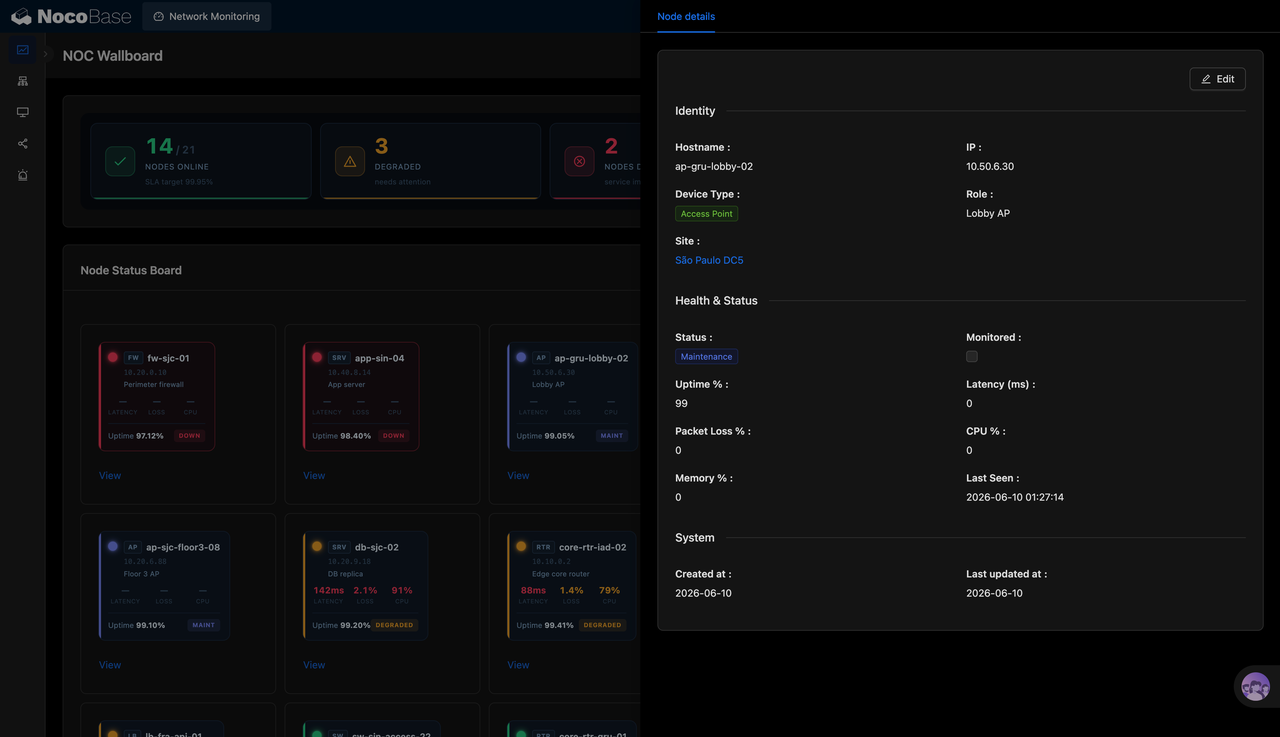
Node details page recording device identity, status, and health metrics:
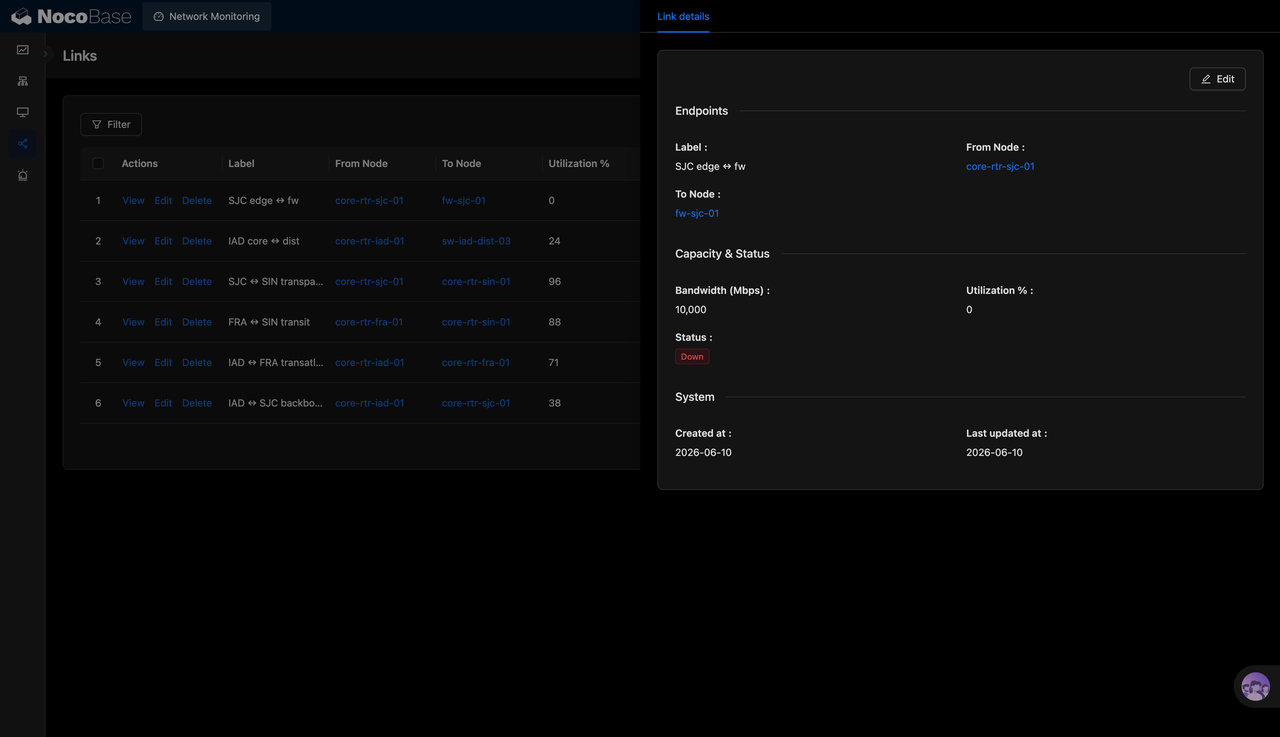
Link details page showing endpoints, bandwidth, utilization, and connection status:
Node list for viewing device type, site, status, and availability:
AI-generated network health report with device type metrics:
What Problems Can a Network Monitoring Dashboard Solve?
The hardest part of network operations is not just knowing whether a node is online. Teams also need to know which nodes affect service, which nodes are only in a maintenance window, which links have utilization risks, and which alerts have not been acknowledged.
Node status cards provide device-level details. Each node can show hostname, IP, device type, role, latency, packet loss, CPU, availability, and status labels. This helps teams identify whether an issue comes from device downtime, resource pressure, link quality, or planned maintenance.
A real-time alert stream helps the team follow unresolved incidents. Interface flapping, high memory usage, node outages, and expiring certificates can be shown in one place, with acknowledgment actions to prevent alerts from being buried in message streams.
AI network health reports turn scattered monitoring data into management-level insights. The system can analyze 21 network nodes, six device types, overall availability, the proportion of degraded or down nodes, CPU and memory pressure, and health comparisons across device types, helping teams produce faster incident reviews and optimization suggestions.
Key Features
Node Status Dashboard
- Node cards: Display hostname, IP, device type, and role for each node.
- Status labels: Support statuses such as online, degraded, down, and maintenance.
- Health metrics: Show latency, packet loss, CPU, and availability metrics.
- Site identification: Associate nodes with sites such as Singapore, Santa Clara, and São Paulo data centers.
- Quick access: Open the details page from a node card to review more complete device information.
Link Management
- Endpoint relationships: Record which node a link starts from and which node it connects to.
- Link labels: Describe link relationships, such as edge to firewall or core to distribution.
- Bandwidth records: Store link bandwidth, for example 10,000 Mbps.
- Utilization tracking: Show link utilization to identify high-load connections.
- Link status: Record whether a link is healthy or disconnected.
AI Network Health Reports
- Node data analysis: AI can read the node table and generate a network infrastructure health report.
- Device type comparison: Analyze health metrics by routers, switches, firewalls, servers, load balancers, access points, and other device types.
- Resource pressure detection: Identify abnormal CPU, memory, latency, and packet loss.
- Operational status summary: Summarize nodes by online, degraded, maintenance, and down statuses.
Why Build a Network Monitoring Dashboard with AI and NocoBase?
A network monitoring dashboard needs to cover node inventory, device types, sites, operating status, availability, latency, packet loss, CPU, memory, link utilization, real-time alerts, and health reports. It helps NOC and IT operations teams continuously understand the condition of their network infrastructure.
If the team only uses pure Vibe Coding to generate an early page prototype, it may quickly create node cards, a link list, or an alert area. Long-term maintenance becomes more complex as device types, site structures, alert levels, SLA definitions, link relationships, and permission scopes keep changing. A monitoring dashboard also needs to support real operations data and review reports over time.
NocoBase can serve as the business foundation for this type of dashboard by connecting nodes, sites, device types, links, alerts, and health metrics. AI helps the team generate the NOC dashboard, node list, node details, link details, alert stream, and network health report faster.
When the network architecture changes later, the team can continue adjusting device fields, status rules, site structures, link relationships, alert categories, and permission scopes in NocoBase. This makes the network monitoring dashboard more suitable for long-term use by NOC, IT operations, infrastructure, security operations, and management teams to track network status, locate risky nodes, review alert events, and support daily operations decisions.
FAQ
1.Who is this network monitoring dashboard suitable for?
It is suitable for NOC, IT operations, infrastructure, network engineering, security operations, and data center management teams. It is especially useful for enterprises that need to track node status, link utilization, and alert events over the long term.
2.Can the system show the overall network status?
Yes. The NOC dashboard shows online nodes, degraded nodes, offline nodes, unacknowledged critical alerts, and overall availability for the last 30 days, making it suitable for real-time operations overview.
3.Does it support node status management?
Yes. The screenshots show statuses such as online, degraded, down, and maintenance. Both the node list and node cards can display the current status.
4.Can I view details for a single node?
Yes. The node details page shows hostname, IP, device type, role, site, status, monitoring status, availability, latency, packet loss, CPU, memory, and last seen time.
5.Does it support different device types?
Yes. The screenshots include routers, switches, firewalls, servers, load balancers, and access points, making it suitable for managing multiple network device types.
6.Can nodes be viewed by site?
Yes. The node details page and node list include site fields such as Singapore DC4, São Paulo DC5, Frankfurt DC3, and Santa Clara DC2.
7.Does it support link management?
Yes. The link page shows link labels, source nodes, target nodes, utilization, bandwidth, and status, making it suitable for managing connections between nodes.
8.Can the system show link utilization?
Yes. Both the link list and details page include utilization fields. The screenshots also show utilization data such as 96%, 88%, and 71%.
9.Does it support real-time alerts?
Yes. The right side of the dashboard shows a real-time alert stream, including interface flapping, high memory usage, node outages, and certificate expiration alerts.
10.Can alerts be acknowledged?
Yes. Each alert in the screenshot has an acknowledgment action, allowing operations staff to mark events as noticed or handled.
11.Can I view recent node availability?
Yes. The availability area shows the last 30 monitoring intervals and displays the availability rate of each node.
12.Can AI generate a network health report?
Yes. The screenshots show that AI Agent has generated a network infrastructure health report based on node data, including device type health metrics, operational status summaries, and key risk notes.
13.Can AI reports be exported?
Yes. The report page shows Markdown, HTML, and PDF actions. Reports can be downloaded as Markdown or HTML, or printed as PDF.
14.Can Claude Code, Codex, Cursor, or OpenCode help build it?
Yes. These AI Agents can help generate the initial table structure, page layout, node details, link details, alert pages, and report prompts. The data relationships, permissions, and status rules should then be maintained in NocoBase.
15.How is this different from pure Vibe Coding?
Pure Vibe Coding is more suitable for quickly creating a page prototype. A network monitoring dashboard involves nodes, links, sites, alerts, statuses, health metrics, and permission management. NocoBase can support long-term maintenance, while AI speeds up setup and report generation.
16.Does it support permission control?
The screenshots do not directly show a permission configuration page, but NocoBase supports permission management. Enterprises can set different data access and operation scopes for NOC duty staff, network engineers, administrators, and management teams.
17.Can monitoring fields be adjusted later?
Yes. Network monitoring fields often change, such as adding interface status, certificate validity, device vendor, data center area, alert level, or SLA definitions. After building it with NocoBase, teams can continue adjusting tables, pages, and report content without rebuilding the whole system.